Poverty in Hong Kong remains one of the most pressing social challenges facing the city. Despite being a global financial hub, the wealth gap continues to widen, leaving many residents struggling to meet basic needs. Understanding the scale and distribution of poverty requires looking at hard numbers, demographic patterns, and geographic disparities across the territory’s 18 districts.
Hong Kong’s poverty rate affects over 1.4 million residents, with significant variations across districts and age groups. Elderly citizens face the highest poverty risk at nearly 45%, while districts like Sham Shui Po and Kwun Tong show concentrated disadvantage. Government intervention reduces the poverty rate from 23.6% to 14.9% after policy measures, highlighting both the scale of need and the impact of social programs on vulnerable populations.
Understanding poverty measurement in Hong Kong
Hong Kong uses a relative poverty line set at 50% of median household income. This approach adjusts for household size and reflects the local cost of living.
The government calculates poverty rates before and after policy intervention. This two-step measurement shows both the raw extent of economic disadvantage and how social programs help bridge the gap.
Before intervention, the poverty line sits at different thresholds depending on household composition. A single-person household falls below the poverty line at approximately HK$4,400 monthly income. For a four-person household, that threshold rises to around HK$16,200.
After accounting for cash benefits, tax rebates, and public housing subsidies, the effective poverty rate drops substantially. This difference reveals how critical government support has become for low-income families.
Current poverty rates across Hong Kong
The latest data shows 1.4 million Hong Kong residents living in poverty before policy intervention. That represents 20.4% of the population.
After government measures, the number drops to approximately 1.09 million people, or 14.9% of residents. While intervention helps, the remaining figure still represents a significant portion of the city’s population facing economic hardship.
These numbers have fluctuated over recent years due to economic cycles, policy changes, and external shocks. The pandemic period saw temporary spikes in poverty rates as employment contracted and small businesses closed.
Year-over-year comparisons reveal concerning trends:
- Poverty rates among working households have increased
- The gap between rich and poor continues to widen
- More middle-income families are sliding toward the poverty threshold
- Recovery from economic disruptions has been uneven across sectors
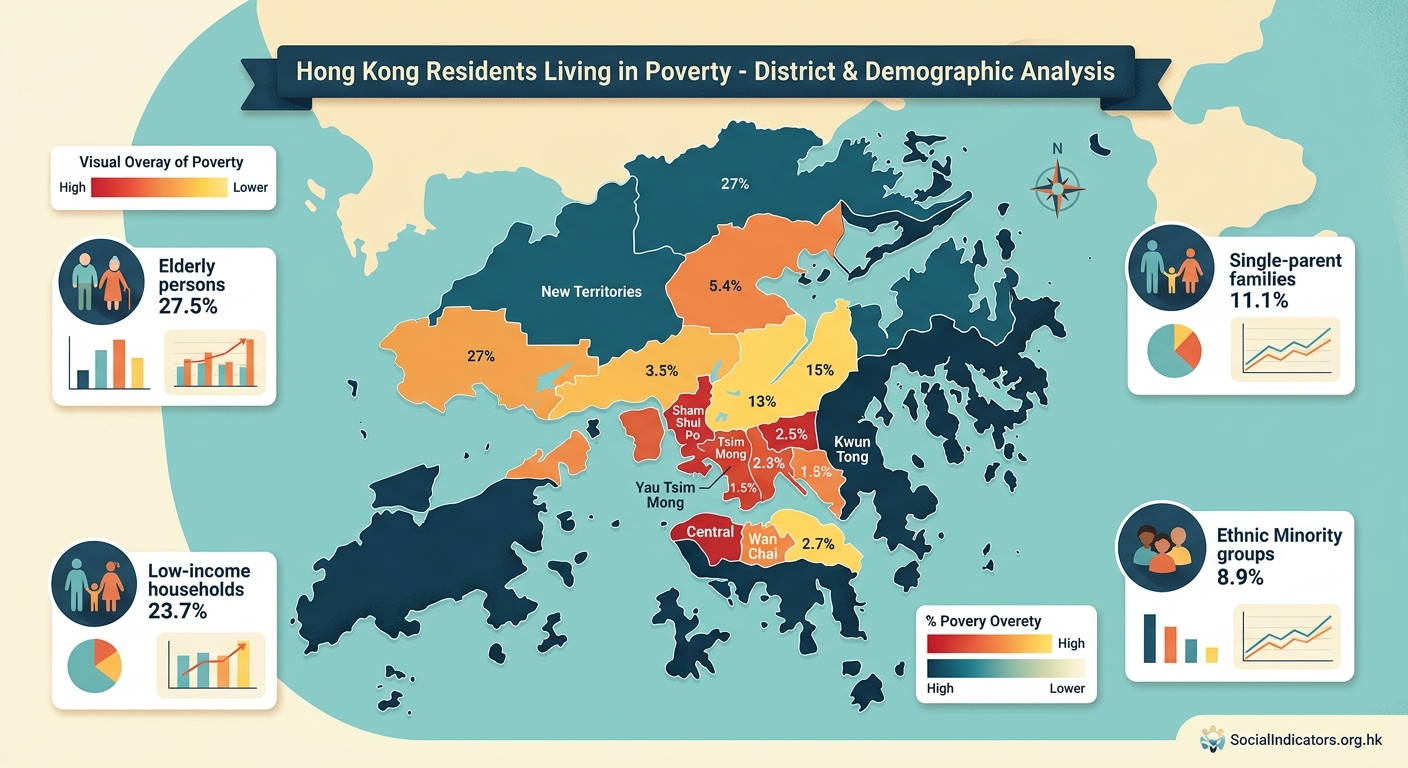
District-level breakdown of poverty
Poverty concentrates in specific districts, creating pockets of disadvantage across the territory.
| District | Poverty Rate (%) | Primary Factors |
|---|---|---|
| Sham Shui Po | 26.8 | Aging housing stock, elderly population, limited job access |
| Kwun Tong | 24.3 | Industrial decline, subdivided units, service sector jobs |
| Yau Tsim Mong | 23.7 | Tourism dependence, transient population, high rents |
| Wong Tai Sin | 22.1 | Public housing concentration, elderly residents |
| Kwai Tsing | 21.4 | Manufacturing decline, container port workers |
These districts share common characteristics. Older housing stock predominates. Public housing estates cluster together. Transportation to job centers can be challenging. Educational resources lag behind more affluent areas.
Contrast these figures with districts showing lower poverty rates. Central and Western district registers around 12.8%. Eastern district sits at 13.5%. Islands district, despite including Lantau’s rural areas, shows 15.2%.
The geographic divide reflects historical development patterns, infrastructure investment, and economic opportunity distribution. Districts that transitioned successfully from manufacturing to service economies fare better. Areas with strong transportation links to commercial centers show lower poverty rates.
Demographic patterns in poverty data
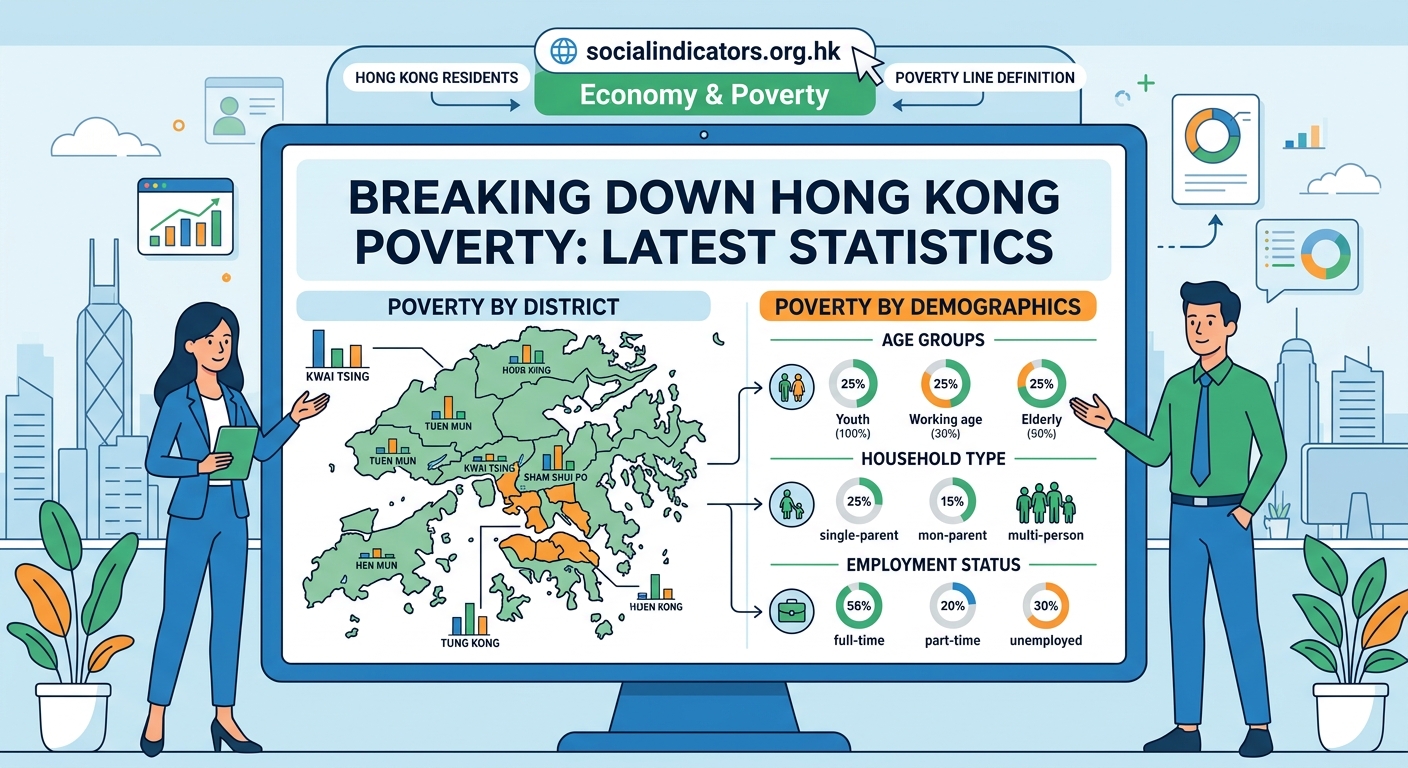
Age represents the single strongest predictor of poverty risk in Hong Kong.
Elderly residents aged 65 and above face a poverty rate of 44.4% before intervention. Even after government support, 30.8% remain below the poverty line. This reflects inadequate retirement savings, limited pension coverage, and rising healthcare costs.
Children and youth show different patterns:
- Children under 18 have a poverty rate of 23.4% before intervention
- Young adults aged 18 to 29 face increasing economic pressure from housing costs
- Educational expenses create additional strain on families with school-age children
Working-age adults between 30 and 64 show the lowest poverty rates, but this group has seen deteriorating conditions. The rise of precarious employment, part-time contracts, and gig economy work has eroded income stability.
Household composition matters significantly. Single-person elderly households face the highest poverty risk. Multi-generational households often struggle when only one or two members can work while others require care.
Employment status and poverty correlation
Having a job no longer guarantees escape from poverty. The working poor represent a growing segment of those below the poverty line.
Approximately 620,000 employed individuals live in poor households. Low wages, irregular hours, and lack of benefits trap workers in poverty despite full-time employment.
Sectors with highest concentrations of working poor include:
- Retail and sales
- Food service and hospitality
- Security and cleaning services
- Elderly care and domestic work
- Transportation and logistics
These industries typically offer minimum wage or slightly above, with limited advancement opportunities. Workers often juggle multiple part-time positions to make ends meet.
Unemployment and underemployment hit certain demographics harder. Middle-aged workers who lost manufacturing jobs struggle to retrain. New graduates face fierce competition for entry-level positions. Single parents find childcare costs consume much of their earnings.
“Poverty is not just about income. It’s about access to opportunity, social mobility, and the ability to plan for the future. When working families cannot afford decent housing or save for emergencies, the entire social fabric weakens.” (Social policy researcher)
Housing costs and poverty dynamics
Housing represents the largest expense for most Hong Kong households. Soaring property prices and rents push families toward the poverty line even when incomes remain stable.
Subdivided units house approximately 226,000 people, many living in spaces under 100 square feet per person. Monthly rents for these cramped accommodations often exceed HK$4,000, consuming 40% or more of household income.
The public housing waiting list stretches beyond five years for general applicants. During that wait, families pay market rents that leave little for other necessities.
Housing poverty manifests in several ways. Families skip meals to pay rent. Children lack space for homework. Health problems arise from poor ventilation and overcrowding. Transportation costs increase when families move to cheaper peripheral areas.
Government housing subsidies help, but demand far outstrips supply. The gap between market rents and what low-income families can afford continues to widen.
Education and intergenerational poverty
Educational disadvantage perpetuates poverty across generations. Children from poor families face multiple barriers to academic success.
Lack of study space at home affects concentration and learning. After-school tutoring, common among middle-class families, remains unaffordable. Technology gaps became especially apparent during pandemic-era online learning.
Schools in poorer districts often have fewer resources. Teacher turnover rates run higher. Extracurricular programs that build skills and confidence are limited.
The data shows clear correlation between parental education levels and child poverty rates. Households where neither parent completed secondary education show poverty rates above 35%. University-educated parents see rates below 8%.
Breaking this cycle requires targeted intervention. Programs providing mentorship, tutoring, and enrichment activities show positive results. Yet funding remains inconsistent and coverage incomplete.
Policy interventions and their effectiveness
Government poverty alleviation measures include cash transfers, public housing, healthcare subsidies, and educational support.
The Comprehensive Social Security Assistance (CSSA) program provides basic income support to those unable to work. Elderly recipients receive additional allowances. Families with children get supplements for education expenses.
The Working Family Allowance offers income supplements to low-income working households. This program aims to make work pay while supporting families.
Public housing remains the most significant intervention. Subsidized rents allow families to allocate income to other needs. However, long waiting times limit immediate impact.
Healthcare subsidies through the public hospital system prevent medical expenses from pushing families into poverty. Elderly healthcare vouchers help seniors access primary care.
These programs reduce the poverty rate by 8.7 percentage points. Yet gaps remain. Coverage doesn’t reach all who need help. Benefit levels often fall short of actual living costs. Application processes can be complex and intimidating.
Comparing Hong Kong to regional peers
Hong Kong’s poverty rate sits higher than several developed Asian economies but lower than others.
Singapore reports a poverty rate around 10% using comparable methodology. Japan’s relative poverty rate reaches 15.7%. South Korea shows 16.7%. Taiwan registers approximately 11%.
Different social safety net structures explain some variation. Singapore’s Central Provident Fund creates mandatory savings. Japan’s universal healthcare and pension systems provide broader coverage. Korea has expanded welfare programs significantly over the past decade.
Hong Kong’s lower tax rates mean less government revenue for social programs. The territory’s traditional emphasis on self-reliance and family support has shifted slowly toward more comprehensive welfare provision.
Wealth inequality measures tell another part of the story. Hong Kong’s Gini coefficient, measuring income inequality, ranks among the highest in developed economies. The gap between top and bottom income deciles continues to grow.
Data sources and methodology considerations
Understanding poverty statistics requires knowing how data gets collected and analyzed.
The Census and Statistics Department conducts regular household surveys. These capture income, expenditure, household composition, and housing conditions. Sample sizes typically include tens of thousands of households to ensure statistical validity.
The relative poverty line methodology has both strengths and limitations. It captures inequality and reflects local living standards. However, it can show improving poverty rates even when absolute living conditions deteriorate, as long as median incomes fall faster.
Some researchers advocate for supplementary measures. A basic needs basket approach would calculate the actual cost of food, housing, clothing, and other essentials. Deprivation indices measure inability to afford specific items or activities.
Data timeliness presents challenges. Full poverty reports typically appear one to two years after the survey period. Rapid economic changes may not show up immediately in statistics.
Underreporting affects accuracy. Some households hesitate to disclose full income details. Informal economy earnings often go unreported. Wealthy households may understate investment income.
Emerging trends and future projections
Several factors will likely influence poverty rates over coming years.
Population aging accelerates. By 2036, one in three Hong Kong residents will be aged 65 or above. Without policy changes, elderly poverty will increase substantially.
Automation and artificial intelligence threaten jobs in retail, food service, and logistics. Workers in these sectors already face high poverty risk. Technological displacement could worsen their situation.
Climate change brings new challenges. Extreme weather events disproportionately affect poor households with inadequate housing. Rising temperatures increase cooling costs. Flooding risks concentrate in older, lower-lying districts.
The shift toward a knowledge economy creates opportunities for some but leaves others behind. Digital literacy becomes essential for employment. Those without education or training face shrinking job prospects.
Housing affordability shows no signs of improving. Land supply constraints, development delays, and strong demand keep prices elevated. The gap between incomes and housing costs will likely persist.
Making sense of the numbers
Hong Kong poverty statistics paint a picture of a divided city. Wealth and want exist side by side, separated by districts, demographics, and opportunity.
The data matters because it informs policy decisions, allocates resources, and holds government accountable. Researchers use these numbers to identify trends and evaluate interventions. Journalists rely on statistics to tell human stories. Advocates point to the data when pushing for change.
Behind every percentage point are real people. Elderly residents choosing between medicine and meals. Children growing up in cramped subdivided units. Workers taking multiple jobs but still falling short. Families one emergency away from crisis.
Understanding the statistics is the first step. Translating that understanding into effective action remains the ongoing challenge. The numbers show both the scale of the problem and the impact of solutions. They reveal where intervention works and where gaps persist.
For anyone working on social policy, conducting research, or simply trying to understand Hong Kong’s social landscape, these statistics provide essential context. They measure not just economic outcomes but the lived reality of more than a million residents navigating daily hardship in one of the world’s wealthiest cities.
Leave a Reply