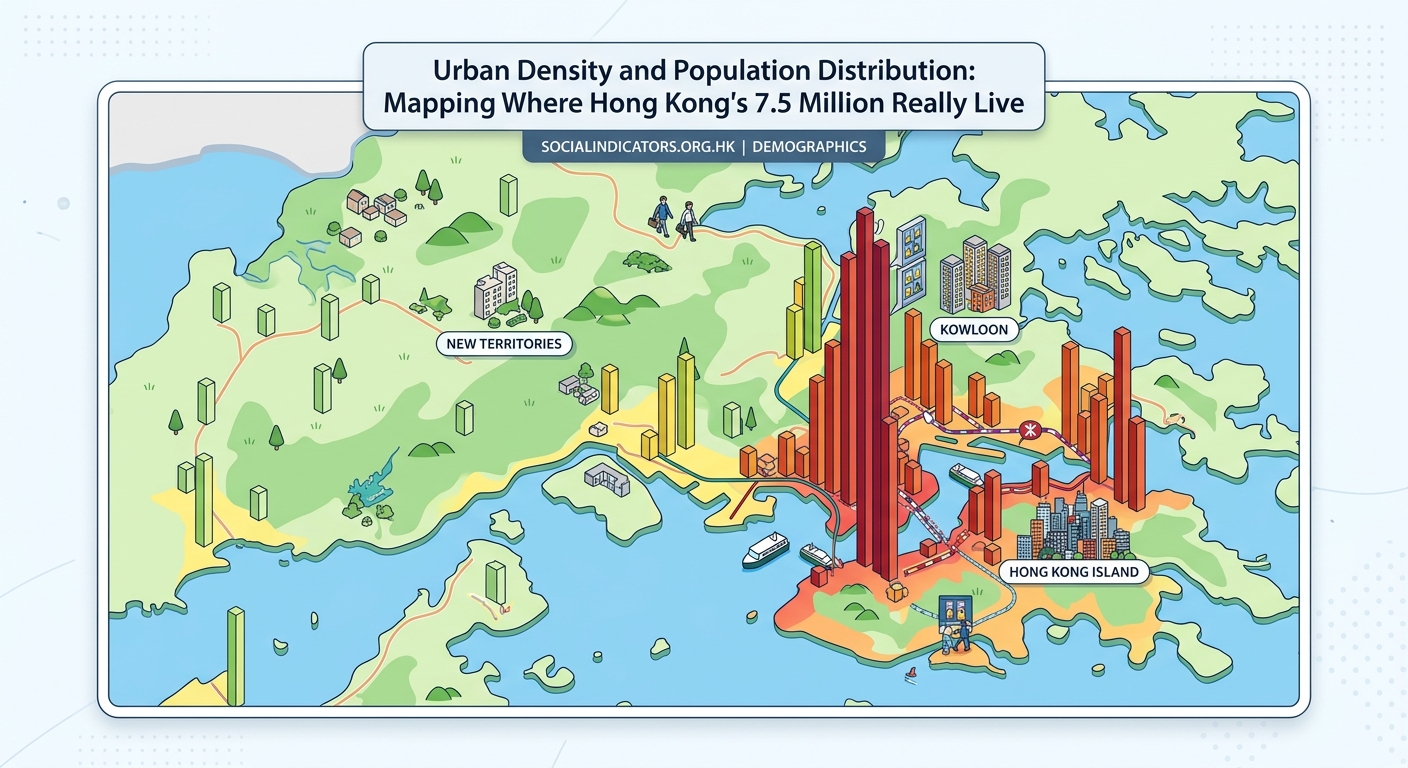
Urban Density and Population Distribution: Mapping Where Hong Kong’s 7.5 Million Really Live
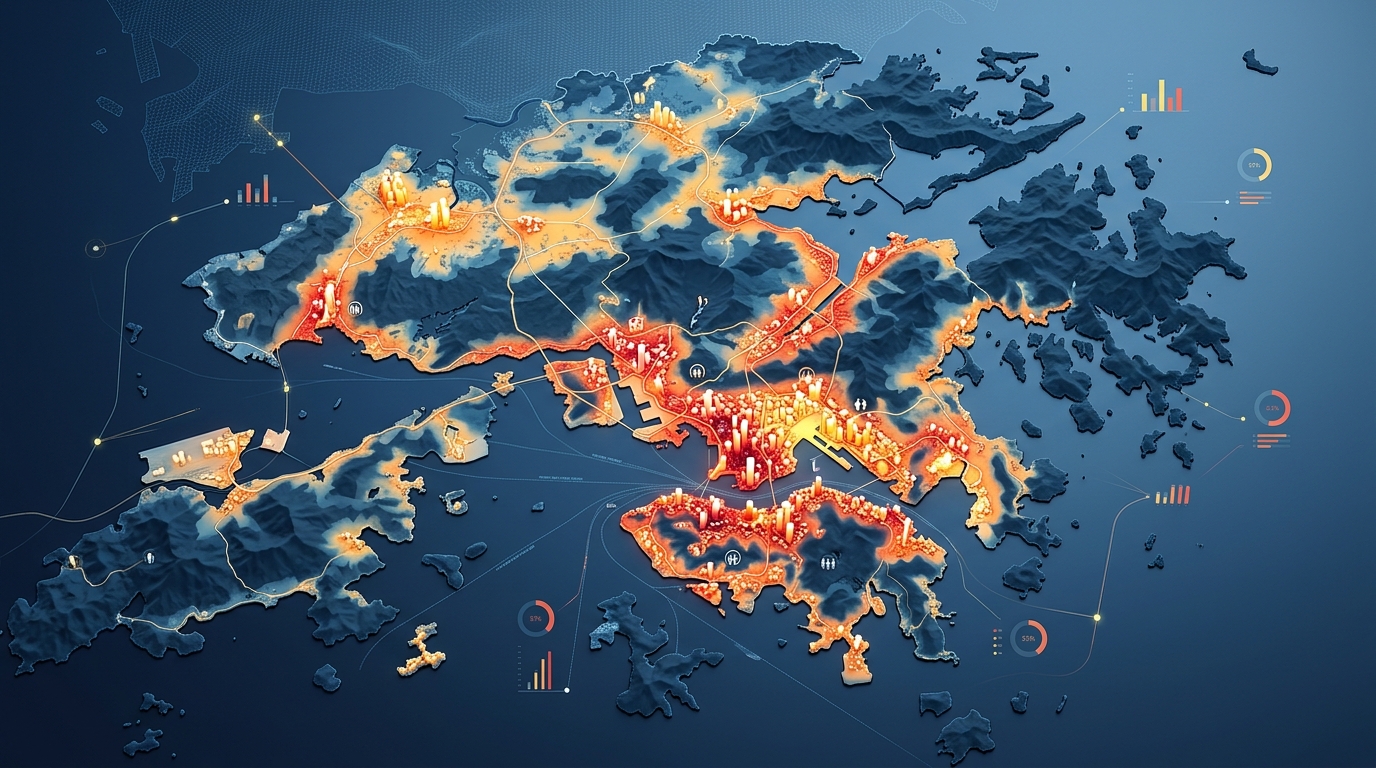
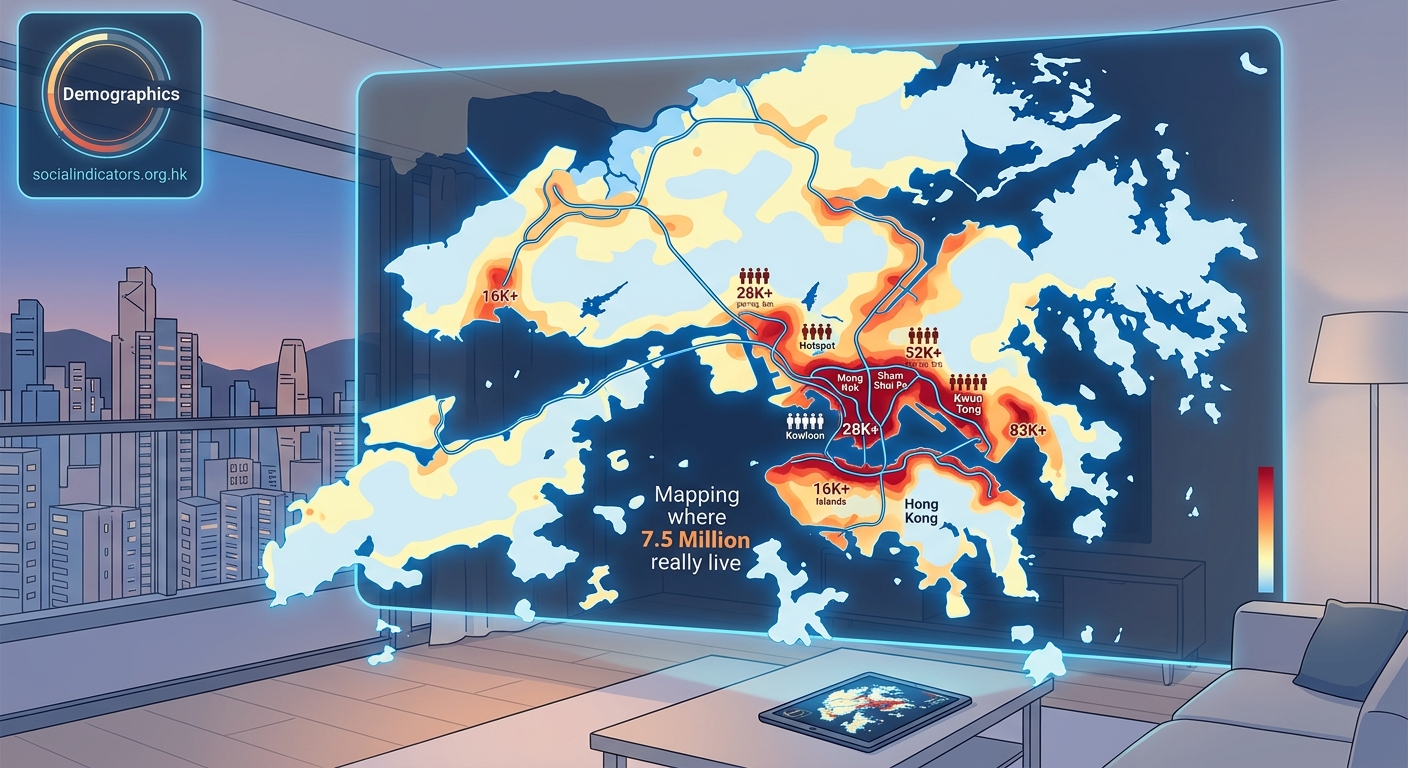
Hong Kong packs 7.5 million people into just over 1,100 square kilometers, making it one of the most densely populated places on Earth. But those millions aren’t spread evenly. Understanding where people actually live requires looking beyond simple averages to see the real patterns of concentration, the pockets of density, and the surprisingly empty spaces that still exist across the territory.
Hong Kong’s population clusters heavily in the urban areas of Kowloon and Hong Kong Island, with densities exceeding 50,000 people per square kilometer in some districts. Meanwhile, 75% of the territory remains undeveloped country parks and rural land. Accurate population distribution mapping reveals stark contrasts between hyper-dense urban cores and sparsely populated outlying areas, essential data for urban planning and policy development.
Where the density really sits
Most people picture Hong Kong as a wall of skyscrapers. That image holds true for specific areas, but the full picture tells a different story.
Kowloon holds the crown for density. Districts like Kwun Tong, Sham Shui Po, and Wong Tai Sin regularly exceed 40,000 to 50,000 people per square kilometer. Some individual neighborhoods push even higher. Mong Kok, often cited as the densest neighborhood globally, can reach over 130,000 people per square kilometer in its most concentrated blocks.
Hong Kong Island shows similar patterns in specific zones. The northern shore from Central to Causeway Bay sees intense commercial activity during the day, but residential density peaks in areas like Sai Ying Pun, Shau Kei Wan, and the mid-levels. The southern side of the island, including areas like Stanley and Repulse Bay, shows dramatically lower density despite being fully developed.
The New Territories present the most varied picture. New towns like Sha Tin, Tuen Mun, and Tai Po were purpose-built to house hundreds of thousands of residents, creating density hotspots surrounded by green space. Between these planned communities, you find villages, farmland, and protected areas with minimal population.
Reading the numbers behind the maps
Population distribution data comes from multiple sources, each with different strengths.
The Census and Statistics Department conducts a full population census every ten years, with by-census surveys in between. These provide the most authoritative numbers, broken down by Tertiary Planning Unit (TPU), a geographic division smaller than a district but larger than a single building.
Planning Department data adds spatial context. Their land use surveys show not just where people live, but what types of housing dominate each area. Public housing estates, private developments, and village houses create very different density patterns even when population counts seem similar.
Geospatial data layers allow researchers to map population against infrastructure, transportation networks, and environmental features. This reveals relationships that raw numbers miss. For example, MTR stations correlate strongly with population spikes within 500 meters, then density drops sharply.
Here’s how the major regions compare:
| Region | Approximate Population | Land Area (km²) | Average Density (per km²) |
|---|---|---|---|
| Hong Kong Island | 1,270,000 | 80.5 | 15,800 |
| Kowloon | 2,240,000 | 46.9 | 47,700 |
| New Territories | 3,990,000 | 975.2 | 4,100 |
Those averages hide extreme variation. Kowloon’s 47,700 average includes less dense areas like Kowloon City alongside the packed neighborhoods of Yau Tsim Mong. The New Territories average of 4,100 drops to nearly zero in country parks but spikes above 30,000 in new town centers.
Building your own distribution analysis
If you need to work with Hong Kong population data for research or planning, follow these steps:
-
Start with official census data from the Census and Statistics Department. Download the most recent population by-census figures, which break down residents by TPU and include demographic details like age, household size, and housing type.
-
Obtain geographic boundary files. The Planning Department provides GIS shapefiles for district boundaries, TPUs, and other planning units. These let you map census numbers onto actual geography.
-
Layer in contextual data. Add MTR stations, bus routes, schools, hospitals, shopping centers, and employment zones. Population distribution makes more sense when you see what draws people to specific areas.
-
Use GIS software to visualize patterns. Free tools like QGIS work well for basic mapping. Color-code areas by density, create heat maps, or run spatial analysis to identify clusters and outliers.
-
Cross-reference with planning documents. The Hong Kong Planning Standards and Guidelines explain how population projections inform infrastructure planning. Comparing actual distribution against planned capacity reveals gaps and pressures.
-
Update regularly. Population shifts over time as new developments complete, older estates age, and economic patterns change. Annual updates from the Statistics Department help track trends.
Common mistakes when interpreting the data
Many analyses of Hong Kong population distribution stumble over the same issues:
-
Confusing daytime and residential populations. Central has relatively few residents but hundreds of thousands of workers flood in daily. Mapping only residential population misses this dynamic.
-
Ignoring vertical density. Two areas with the same population per square kilometer look identical on a flat map, but one might house people in 40-story towers while the other uses low-rise developments. The lived experience differs completely.
-
Overlooking temporal changes. Using decade-old census data produces misleading conclusions. Major developments like the opening of new MTR lines or completion of large housing estates can shift thousands of residents within months.
-
Treating districts as uniform. Wan Chai district includes both hyper-dense Happy Valley and the relatively sparse southern slopes. District-level averages wash out the variation that matters for detailed planning.
“Population distribution mapping isn’t just about counting heads. It’s about understanding how people move, where they work, how they access services, and how all those patterns create pressure points in the urban system. The map is the starting point, not the answer.” — Urban planning researcher
Why certain areas stay empty
Three-quarters of Hong Kong’s land area remains undeveloped. That’s not an accident.
Country parks cover about 40% of the territory, protected by law since the 1970s. These areas provide watershed protection, biodiversity habitat, and recreational space. Development is essentially prohibited.
Steep terrain makes much of the remaining land unbuildable or prohibitively expensive to develop. Hong Kong’s mountainous topography concentrates feasible development sites along the coasts and in a few inland valleys.
Government land policy also plays a role. Large land banks remain undeveloped, held for future needs or caught in planning processes. Agricultural land in the New Territories faces restrictions despite low productivity.
The result: intense pressure on developable land drives both high property prices and extreme density in areas deemed suitable for housing.
How new towns reshape the pattern
Hong Kong’s new town program, launched in the 1970s, deliberately redistributed population away from the urban core.
Sha Tin now houses over 660,000 people. Tuen Mun holds nearly 500,000. Tseung Kwan O, the newest major development, added capacity for over 400,000 residents in an area that was mostly undeveloped 30 years ago.
These planned communities follow a consistent model:
- High-density residential zones centered on MTR or KCR stations
- Integrated shopping centers providing retail and services
- Schools, clinics, and community facilities within walking distance
- Industrial or commercial zones providing local employment
- Green buffers separating new towns from each other and from older settlements
The model works, but creates its own challenges. Residents often still commute to jobs in Kowloon or on Hong Kong Island, stressing transportation networks. New towns can feel isolated despite their size. And as the first generation of new towns ages, they face infrastructure renewal needs.
What the distribution means for services
Population clustering creates both efficiencies and challenges for service delivery.
Dense areas support frequent public transport, walkable access to schools and clinics, and efficient utility networks. Kowloon’s density makes it economical to run buses every few minutes and to site a hospital within reach of hundreds of thousands of residents.
Sparse areas struggle with the opposite problem. Outlying islands and rural New Territories settlements can’t justify frequent ferry service or multiple school locations. Residents face longer journeys for basic services.
Demographic patterns layer onto geographic distribution. Aging districts like Sham Shui Po need more elderly care facilities. Family-oriented new towns need primary schools. Districts with many subdivided flats need different social services than areas dominated by middle-class homeowners.
Planners use population distribution maps to forecast needs:
- Where will demand for school places grow or shrink over the next decade?
- Which districts need additional elderly care capacity?
- Where should new sports facilities or libraries locate to serve underserved populations?
- How will transportation demand shift as employment zones evolve?
Tracking change over time
Hong Kong’s population distribution isn’t static. Several trends are reshaping where people live.
Aging in place: Older districts see their populations age as long-time residents stay put while younger families move to newer, larger flats elsewhere. This changes service needs without changing population totals.
Redevelopment: Urban renewal projects in areas like Kwun Tong and To Kwa Wan replace older, lower-density buildings with taller towers, increasing local population even as the footprint stays the same.
New supply: Major reclamation and development projects add capacity in previously undeveloped or underdeveloped areas. The Kai Tak Development, built on the old airport site, will eventually house 50,000 residents where none lived before.
Cross-border integration: Growing economic ties with Shenzhen influence where people choose to live. Some Hong Kong residents now live across the border and commute in, while others base themselves in Hong Kong but work in the Greater Bay Area.
Tools and resources for deeper analysis
Several platforms provide access to Hong Kong population data:
The Census and Statistics Department maintains a data portal with downloadable tables and interactive tools. You can filter by district, age group, housing type, and other variables.
The Planning Department’s Geographic Information System provides spatial data layers that can be combined with population figures. Their online map viewer lets you see planning boundaries and land use without needing specialized software.
Academic institutions like HKU and CUHK publish research using population distribution data. These studies often provide deeper analysis than raw government statistics, examining trends, projections, and policy implications.
International databases like the World Bank and UN Habitat include Hong Kong data in comparative studies of global urban density and population patterns.
Making sense of the extremes
Hong Kong contains some of the most densely populated neighborhoods on Earth alongside areas where you can hike for hours without seeing another person.
That contrast isn’t a bug. It’s the result of deliberate choices about land use, conservation, and urban form. Protecting country parks means accepting higher density in developable areas. Building vertically allows more people to live near jobs and transit while keeping the overall urban footprint compact.
Understanding the distribution helps answer practical questions. Where should a business locate to reach the most customers? Which neighborhoods face the greatest pressure for school places? Where do infrastructure investments provide the most benefit?
The maps tell stories about how Hong Kong grew, where it’s heading, and what tradeoffs shape its unique urban form. For anyone working with Hong Kong’s built environment, population distribution data provides essential context that raw totals and averages miss entirely.
Putting the data to work
Population distribution maps aren’t just academic exercises. They inform real decisions that affect millions of lives.
Urban planners use them to site new facilities, plan transportation networks, and identify areas needing intervention. Researchers analyze patterns to understand housing affordability, environmental justice, and quality of life. Businesses use demographic data to choose locations and target services. Students studying urban geography find Hong Kong an unmatched case study in density, planning, and adaptation to constraints.
The next time you look at Hong Kong’s skyline or ride the MTR through packed neighborhoods, remember that those patterns reflect choices, pressures, and possibilities captured in population distribution data. The 7.5 million people call this place home aren’t scattered randomly. They cluster, spread, and organize themselves in ways that mapping reveals and numbers quantify. Understanding that distribution means understanding how one of the world’s great cities actually works.


Post Comment