5 Critical Indicators That Define Social Progress in Modern Hong Kong
Hong Kong’s rapid transformation from a manufacturing hub to a global financial center has reshaped every aspect of life for its 7.5 million residents. But behind the gleaming skyscrapers and bustling harbor, critical questions emerge about who benefits from this growth and who gets left behind. Understanding social development indicators provides the empirical foundation needed to answer these questions and guide evidence-based policy decisions.
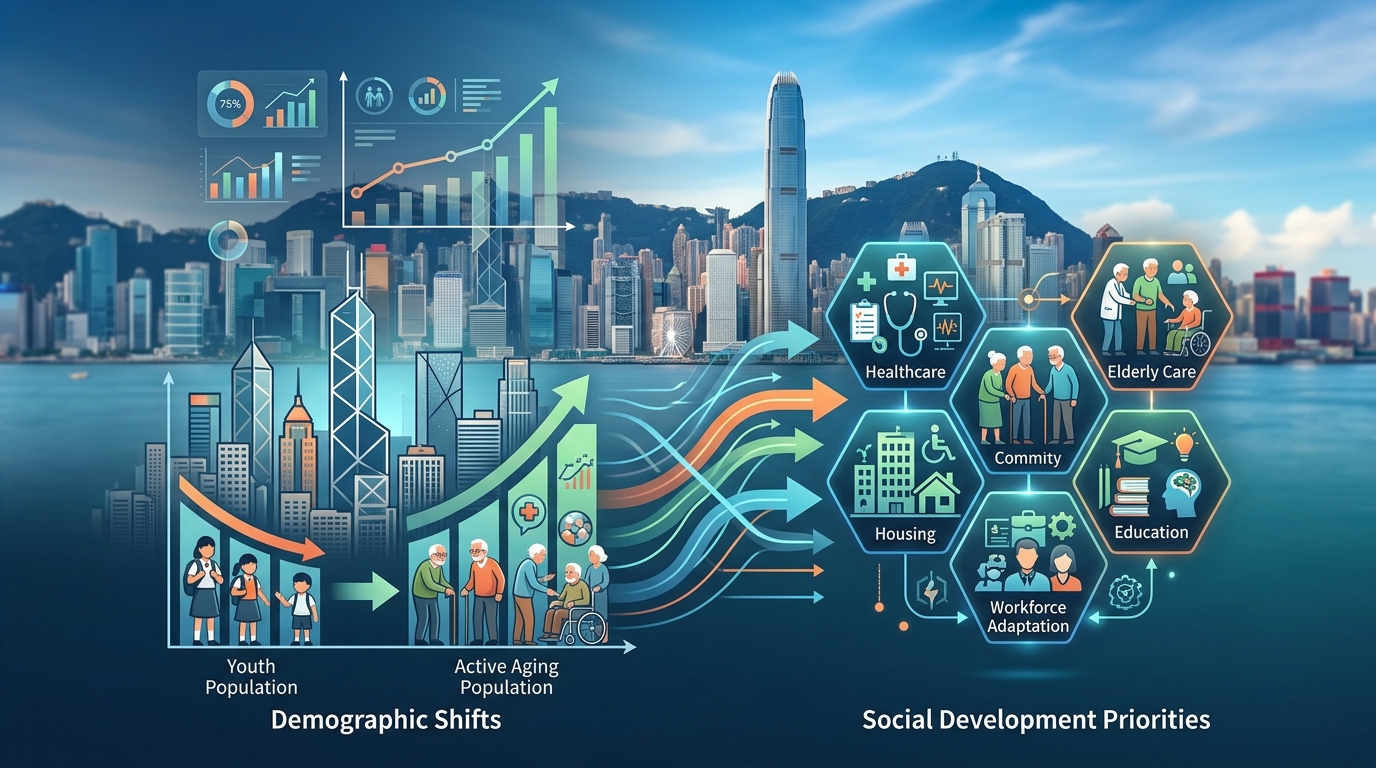
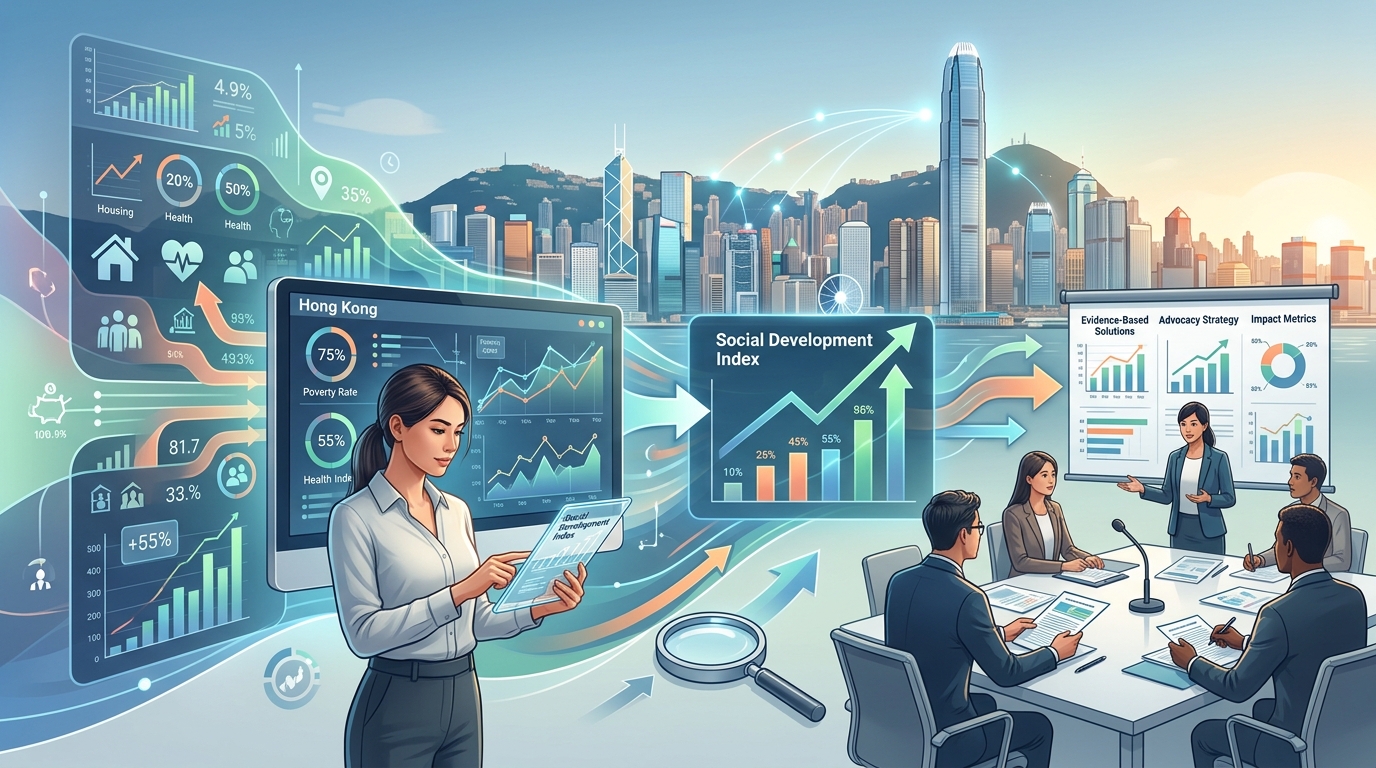
Social development indicators Hong Kong track measurable changes in housing affordability, income distribution, educational attainment, healthcare access, and environmental quality. These metrics form the Social Development Index, a composite measure that reveals whether economic growth translates into improved living standards across different population segments. Researchers and policymakers use these indicators to identify gaps, allocate resources, and evaluate intervention effectiveness.
Understanding the Social Development Index framework
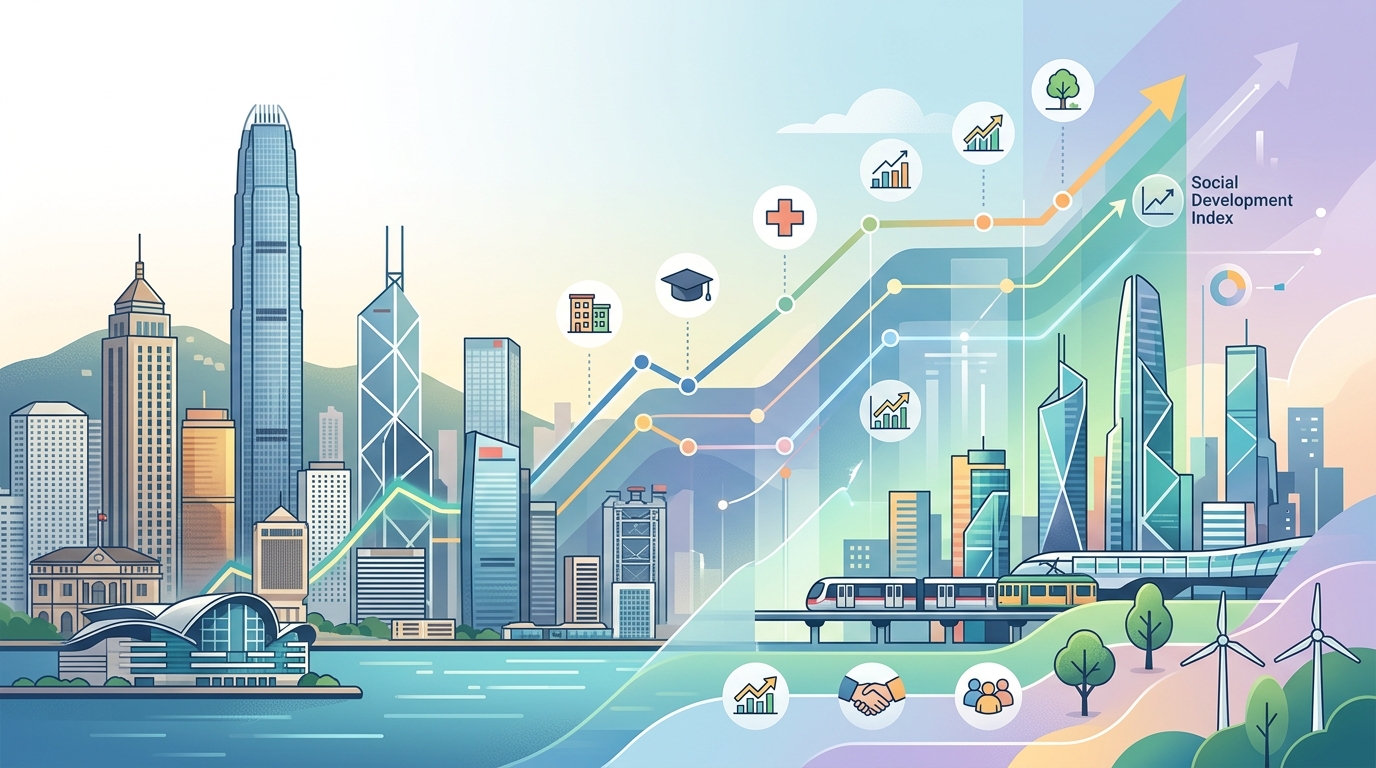
The Social Development Index serves as Hong Kong’s comprehensive scorecard for societal wellbeing. Unlike GDP or stock market indices that measure economic activity, this framework captures how prosperity affects daily life for ordinary residents.
The index combines quantitative data across five primary domains. Each domain contains multiple sub-indicators that government agencies, academic institutions, and civil society organizations monitor continuously. This multi-dimensional approach prevents the common mistake of equating economic growth with social progress.
Data collection follows rigorous methodological standards. Census and Statistics Department surveys form the backbone, supplemented by administrative records from Housing Authority databases, Hospital Authority patient statistics, and Education Bureau enrollment figures. Independent research centers validate findings and highlight measurement gaps.
The framework has evolved since its introduction in the early 2000s. Initial versions focused heavily on material conditions like housing size and household income. Contemporary iterations incorporate subjective wellbeing measures, environmental sustainability metrics, and digital inclusion indicators that reflect changing societal priorities.
Housing affordability and living conditions
Housing represents the most acute social challenge facing Hong Kong residents. The median property price to median household income ratio reached 18.8 in recent years, making homeownership mathematically impossible for most young professionals without family wealth.
Public housing serves 45% of the population through rental estates and subsidized homeownership schemes. Wait times for public rental flats average 5.8 years, forcing families into subdivided units with floor areas as small as 50 square feet per person. These cramped conditions create cascading health and social problems.
Key housing indicators tracked include:
- Average living space per person (currently 161 square feet, among the lowest globally)
- Percentage of households in inadequate housing (estimated at 220,000 households)
- Rent burden ratio (proportion of income spent on housing)
- Public housing production rate versus demand
- Homeownership rates across age cohorts
The government publishes quarterly updates on private housing prices and rental indices. Academic researchers supplement official statistics with field surveys documenting conditions in subdivided units, rooftop structures, and industrial building conversions that fall outside conventional housing categories.
“Housing is not just shelter. It determines access to quality schools, job opportunities, and social networks. When we measure housing affordability, we’re really measuring whether the next generation can build stable lives in Hong Kong.”
This quote from a leading urban studies researcher captures why housing metrics anchor the broader Social Development Index.
Income distribution and economic security
Hong Kong’s Gini coefficient, a standard measure of income inequality, stands at 0.539 before tax and transfers. This places the city among the most unequal developed economies. The coefficient drops to 0.473 after government intervention, revealing the moderating effect of social welfare programs.
Median monthly household income provides a baseline for understanding economic security. Recent figures show HK$28,000 for households overall, but significant variation exists across districts and household types. Single-parent families and elderly households living alone face substantially higher poverty risks.
The official poverty line sits at 50% of median household income, adjusted for household size. Using this threshold, approximately 1.4 million residents (20.4% of the population) live in poverty before policy intervention. After accounting for welfare transfers and public housing subsidies, the rate falls to 14.9%.
Employment indicators complement income data:
- Labor force participation rates by age and gender
- Unemployment and underemployment percentages
- Median wages for different occupational categories
- Job security measures (contract types, benefits coverage)
- Working hours and overtime patterns
Youth unemployment deserves special attention. Graduates entering the labor market during economic downturns face scarring effects that persist throughout their careers. Tracking their employment outcomes helps policymakers design targeted support programs.
Educational access and attainment
Education metrics reveal both achievements and persistent gaps. Hong Kong students consistently rank among global leaders in international assessments like PISA (Programme for International Student Assessment). Yet these aggregate scores mask significant disparities.
Free education extends from primary through senior secondary levels. Participation rates approach 100% for compulsory education years. The challenge lies in quality variation between schools and unequal access to supplementary tutoring that has become nearly universal among middle-class families.
| Indicator | Measurement | Policy Relevance |
|---|---|---|
| Secondary completion rate | Percentage completing Form 6 | Baseline educational attainment |
| Tertiary enrollment | University and vocational program participation | Skills development capacity |
| Achievement gaps | Score differences by socioeconomic status | Educational equity |
| Special education coverage | Students receiving needed support | Inclusive education |
| Teacher qualifications | Credentials and professional development | Instructional quality |
The government tracks student-teacher ratios, per-pupil expenditure, and school facility conditions. Independent researchers examine curriculum relevance, teaching methods, and assessment practices that shape learning outcomes.
Non-Chinese speaking students face particular challenges. Many attend designated schools with fewer resources and limited pathways to local universities. Their educational outcomes serve as an important equity indicator.
Healthcare access and population health
Hong Kong’s dual-track healthcare system combines heavily subsidized public services with a private sector serving those who can afford faster access and more choice. Public hospitals and clinics handle 90% of inpatient care but only 30% of outpatient visits, revealing how residents navigate the system.
Life expectancy stands among the world’s highest at 85.5 years overall (83.0 for males, 88.1 for females). This remarkable achievement reflects clean water, food safety, widespread vaccination, and accessible primary care. But longevity alone doesn’t capture health system performance.
Health indicators monitored include:
- Infant mortality rate (1.7 per 1,000 live births)
- Maternal mortality ratio (among the lowest globally)
- Prevalence of chronic diseases (diabetes, hypertension, cancer)
- Mental health service utilization and wait times
- Elderly care capacity (residential places, community support)
Public hospital accident and emergency department wait times provide a real-time measure of system strain. Median wait exceeds six hours during peak periods, pushing those with means toward private alternatives and creating a two-tier system.
Mental health emerged as a priority indicator following rising youth suicide rates. Government statistics show increasing demand for psychiatric services but limited specialist capacity. Community organizations track unmet needs through surveys and service utilization data.
Environmental quality and sustainable living
Environmental indicators gained prominence as residents increasingly connect air quality, green space access, and climate resilience to quality of life. The Air Quality Health Index provides daily readings across multiple monitoring stations, with readings above 7 triggering health warnings.
Hong Kong generates 1.47 kg of municipal solid waste per person daily, among the highest rates in developed economies. Recycling rates remain stubbornly low at 29% despite government initiatives. Waste management capacity and landfill timelines create urgent sustainability challenges.
Green space accessibility varies dramatically by district. Residents in older urban areas may have minimal park access within walking distance, while new town developments incorporate more planned open space. Geographic information systems map these disparities.
Carbon emissions per capita and building energy efficiency provide climate-related metrics. The government set targets for carbon neutrality by 2050, requiring measurable progress across transportation, building stock, and energy generation.
Water quality in Victoria Harbour has improved substantially following decades of sewage treatment infrastructure investment. Beach water quality monitoring shows most beaches now meet international standards during swimming season, a tangible environmental achievement residents can experience.
Interpreting trends and making comparisons
Social development indicators gain meaning through comparison across time, between districts, and against international benchmarks. A single data point tells little; the pattern reveals whether conditions are improving or deteriorating.
Time series analysis shows Hong Kong’s housing affordability crisis worsening over three decades while health outcomes steadily improved. Income inequality widened during the 1990s and 2000s before stabilizing at elevated levels. These trends inform policy priorities.
District-level breakdowns expose geographic inequality. Median household income in the highest-income district exceeds the lowest by a factor of 2.5. Educational attainment, housing quality, and health outcomes follow similar geographic patterns, concentrating disadvantage in specific neighborhoods.
International comparisons provide context. Hong Kong’s life expectancy leads globally, but income inequality exceeds most OECD countries. Housing affordability ranks among the worst worldwide. These benchmarks help calibrate expectations and identify best practices.
Researchers must account for measurement differences when making comparisons. Poverty definitions, housing adequacy standards, and health metrics vary across jurisdictions. Careful methodological notes accompany responsible data presentation.
Data sources and methodological considerations
Multiple agencies produce social indicators, each with distinct mandates and methods. The Census and Statistics Department conducts the decennial population census plus ongoing household surveys covering income, expenditure, and labor force participation.
Thematic Household Surveys rotate through topics including information technology usage, sports participation, and time use patterns. These provide periodic deep dives into specific aspects of social life not captured in routine data collection.
Administrative data from service delivery agencies offers high-frequency, comprehensive coverage of their domains. Hospital Authority statistics track every public hospital admission. Housing Authority databases contain complete records of public housing applicants and tenants. Education Bureau enrollment data covers all registered schools.
Academic researchers contribute through specialized studies that examine questions beyond government data collection capacity. University surveys explore subjective wellbeing, social capital, civic engagement, and other dimensions difficult to capture through administrative records.
Data quality varies. Income and wealth remain challenging to measure accurately due to non-response and underreporting. Housing conditions in informal or illegal structures escape official statistics. Marginalized populations including ethnic minorities, domestic workers, and asylum seekers appear incompletely in many datasets.
Researchers address these limitations through triangulation, using multiple data sources to cross-validate findings. Qualitative research provides context and captures experiences that quantitative indicators miss. Transparent documentation of methods and limitations maintains credibility.
Applying indicators to policy evaluation
Social development indicators serve their highest purpose when informing policy decisions and evaluating intervention effectiveness. Baseline measurements establish starting conditions. Ongoing monitoring tracks progress. Impact evaluations determine whether programs achieve intended outcomes.
The Minimum Wage ordinance illustrates this process. Before implementation, researchers modeled potential effects on employment, poverty rates, and income distribution using existing labor market data. Post-implementation studies compared actual outcomes against projections, finding modest poverty reduction with minimal employment effects.
Public housing production targets link directly to wait time indicators. When construction falls behind schedule, wait times lengthen predictably. This creates accountability pressure and focuses attention on land supply and construction efficiency bottlenecks.
Education policy debates increasingly reference evidence from indicator tracking. Achievement gap data revealed persistent disparities by socioeconomic status, spurring targeted support programs. Evaluation studies measure whether these interventions narrow gaps over time.
Healthcare resource allocation uses utilization and outcome indicators to identify underserved populations and specialties. Long psychiatric service wait times prompted capacity expansion. Elderly care indicators drive planning for aging population needs.
Common measurement challenges and solutions
Several methodological issues complicate social indicator interpretation. Survey non-response creates potential bias if those who decline participation differ systematically from respondents. Weighting adjustments partially address this but cannot eliminate the problem entirely.
Self-reported data on sensitive topics like income, health behaviors, and family relationships may suffer from social desirability bias. Respondents provide answers they believe are expected rather than accurate accounts. Careful questionnaire design and assurances of confidentiality help but don’t fully resolve the issue.
Defining appropriate units of analysis raises questions. Individual-level data reveals personal circumstances but misses household resource sharing. Household-level analysis obscures intra-household inequality. Both perspectives provide value for different questions.
Temporal comparisons require consistent definitions and methods over time. When measurement approaches change, historical trends become difficult to interpret. Methodological notes must document breaks in series and explain adjustments.
Small sample sizes for minority populations limit statistical reliability of estimates for these groups. Oversampling strategies increase precision but add complexity and cost. Administrative data often provides better coverage for these populations.
| Challenge | Impact | Mitigation Strategy |
|---|---|---|
| Survey non-response | Potential bias in estimates | Weighting adjustments, multiple contact attempts |
| Self-report bias | Underestimation of sensitive behaviors | Validated questions, confidentiality assurances |
| Definition changes | Broken time series | Methodological notes, bridging studies |
| Small subgroups | Unreliable estimates | Oversampling, administrative data supplementation |
| Missing informal sector | Incomplete coverage | Specialized surveys, qualitative research |
The role of independent monitoring
Government agencies produce most official statistics, but independent verification strengthens credibility and fills gaps. University research centers, think tanks, and civil society organizations conduct complementary monitoring.
Independent researchers often examine questions government agencies avoid due to political sensitivity. Studies of protest participation, press freedom, and civil liberties rely on non-governmental data collection. These indicators matter for understanding social development broadly conceived.
Community organizations working directly with marginalized populations document conditions that official statistics miss. Surveys of domestic workers, asylum seekers, and homeless individuals reveal needs invisible in mainstream data sources. This ground-level knowledge informs advocacy and service provision.
International organizations provide external benchmarks and methodological guidance. United Nations agencies publish comparative indicators across countries. These global frameworks help contextualize local findings and identify areas for improvement.
Media organizations increasingly produce data journalism that makes indicators accessible to general audiences. Interactive visualizations and narrative explanations help non-specialists understand trends and their implications. This democratizes access to information needed for informed civic participation.
Future directions in social measurement
Social indicator frameworks continue evolving to address emerging challenges and incorporate new measurement capabilities. Digital inclusion has become a priority as online access determines participation in education, employment, and civic life. Indicators track internet connectivity, digital literacy, and online service usage.
Subjective wellbeing measures complement objective conditions. Life satisfaction, happiness, and sense of meaning provide important information about how people experience their circumstances. These psychological dimensions influence behavior and deserve systematic monitoring.
Environmental sustainability indicators will expand as climate change impacts intensify. Heat stress days, flood vulnerability, and biodiversity loss affect quality of life directly. Carbon footprinting at individual and household levels may become routine.
Real-time data collection using sensors, mobile devices, and administrative systems enables more timely monitoring. Traditional surveys provide annual or quarterly snapshots. Continuous measurement allows faster identification of emerging problems and evaluation of rapid interventions.
Artificial intelligence and machine learning offer new analytical tools for pattern recognition and prediction. These methods can identify vulnerable populations earlier and forecast service needs more accurately. Ethical guidelines must govern their application to prevent algorithmic discrimination.
Making data work for better outcomes
Numbers alone change nothing. Social development indicators fulfill their purpose only when they inform decisions that improve lives. Researchers bear responsibility for clear communication that connects data to real-world implications.
Policymakers need accessible summaries highlighting key trends and actionable insights. Technical reports serve important documentation functions but require translation for decision-makers facing multiple competing priorities. Visualizations and plain-language briefs increase utilization.
Civil society organizations use indicators to advocate for marginalized communities and hold government accountable. Data provides objective grounding for claims about unmet needs and policy failures. Evidence-based advocacy proves more persuasive than anecdotal accounts alone.
Media coverage brings indicators to public attention and shapes political discourse. When journalists report rising inequality or declining housing affordability using credible data, these issues gain salience. Public awareness creates pressure for policy response.
Individual residents can use indicators to understand their circumstances in broader context. Learning that housing cost burdens affect millions validates personal struggles and may inspire collective action. Data literacy empowers citizens to participate meaningfully in democratic processes.
The Social Development Index ultimately serves one purpose: ensuring Hong Kong’s economic success translates into broadly shared improvements in quality of life. Regular monitoring reveals whether this is happening and where gaps require attention. For researchers, analysts, and officials committed to evidence-based governance, these indicators provide essential tools for building a more equitable and sustainable city.
Post Comment