Is Hong Kong’s Economic Growth Failing Its Poorest Residents? 2026 Statistics Answer
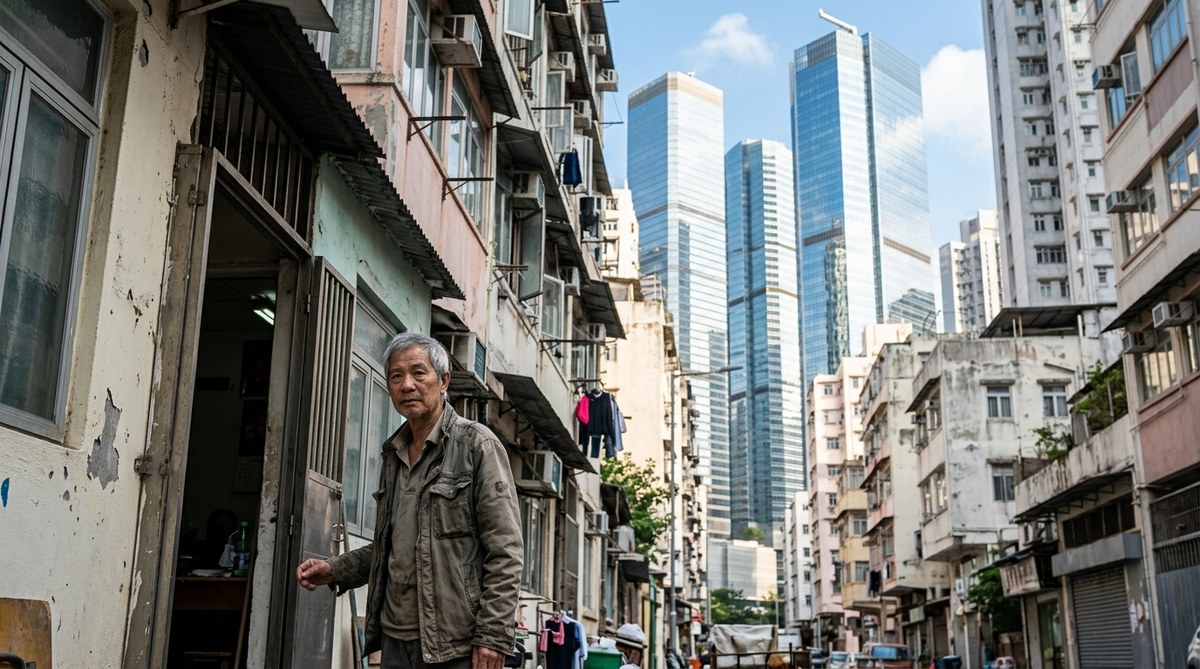
Hong Kong’s skyline tells a story of immense wealth. Glittering towers, luxury boutiques, and a financial sector that rivals any in the world. But beneath that shiny surface, a different story has been unfolding. According to the latest 2026 statistics, Hong Kong’s economic growth is leaving a significant portion of its population behind. The gap between the city’s richest and poorest residents has become one of the widest among developed economies. And the numbers are stark.
Hong Kong’s GDP has grown steadily, yet poverty rates in 2026 remain stubbornly high. Over 1.3 million residents live below the poverty line, and income inequality continues to widen. This article breaks down the latest data on Hong Kong poverty inequality in 2026, explains why growth alone is not fixing the problem, and offers practical steps for using the Social Development Index to advocate for more effective policies.
What the 2026 Numbers Reveal About Poverty in Hong Kong
Hong Kong’s official poverty rate in 2026 stands at roughly 20 percent. That means about one in five residents lives in a household with income below the poverty line. The line itself was revised upward this year to account for soaring living costs, but the number of people it covers has not shrunk.
The Gini coefficient, a standard measure of income inequality, remains above 0.5. For context, a score of 0 means perfect equality and 1 means total inequality. Hong Kong’s score is one of the highest among high income economies. The city has more billionaires per capita than almost anywhere else, yet hundreds of thousands of families struggle to pay for rent, food, and transportation.
A few key figures from 2026 paint the picture:
- Over 1.3 million people live below the poverty line.
- The working poor population has grown. Roughly 600,000 employed individuals still fall under the poverty threshold.
- Elderly poverty rates exceed 40 percent. Older adults are disproportionately affected by inadequate pensions and rising medical costs.
- Income inequality is most extreme in districts like Wan Chai and Central & Western, where high earners live alongside low wage service workers.
These numbers come from the government’s Poverty Situation Report and are consistent with data tracked by the Social Development Index. For a deeper look at how inequality has changed over time, see our analysis on how income inequality in Hong Kong has evolved over three decades.
How Can a Growing Economy Leave More People Behind?
It feels like a contradiction. How can GDP keep rising while poverty stays stubbornly high? The answer lies in who captures the gains from growth.
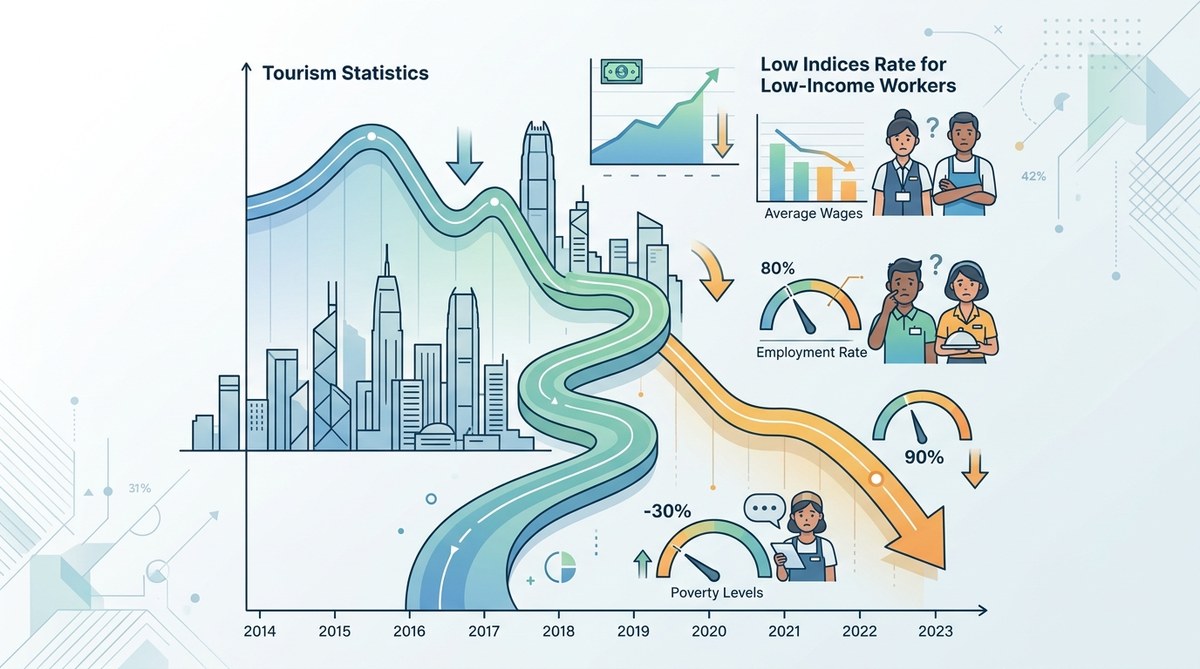
Hong Kong’s economy has rebounded strongly since the pandemic years. Financial services, trade, and tourism have all recovered. But the benefits have flowed mostly to the top. Wages for low skilled workers have not kept pace with inflation. Housing costs have eaten up a larger share of household budgets. And public transportation, food, and utilities have all become more expensive.
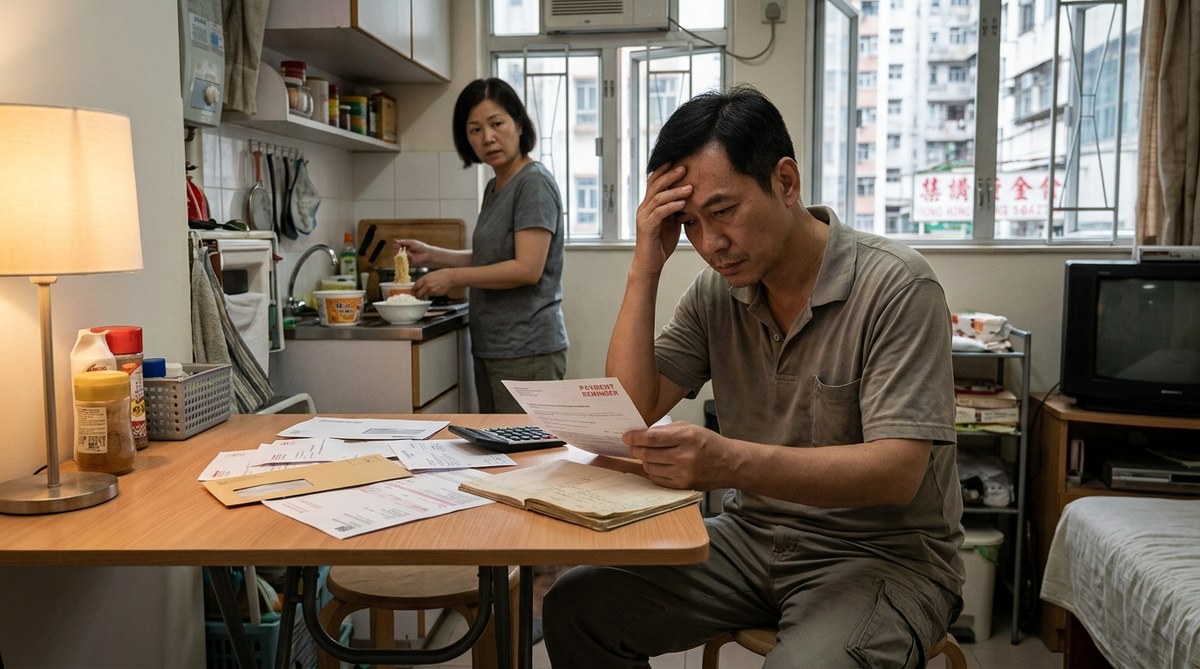
The result is that many families are working harder just to stay in place. They are not falling backward exactly, but they are not moving forward either. And for the poorest households, especially those living in subdivided flats or relying on government assistance, every price increase feels like a setback.
To understand the bigger economic picture, take a look at what 20 years of GDP data reveal about Hong Kong’s economic resilience. It helps explain why growth does not automatically reduce poverty.
Another factor is the changing nature of work. The gig economy has expanded, but many of those jobs offer no benefits, no job security, and irregular pay. Young people, especially those without university degrees, face a tough labor market. For more on that, read about youth unemployment and underemployment as statistical trends shaping a generation.
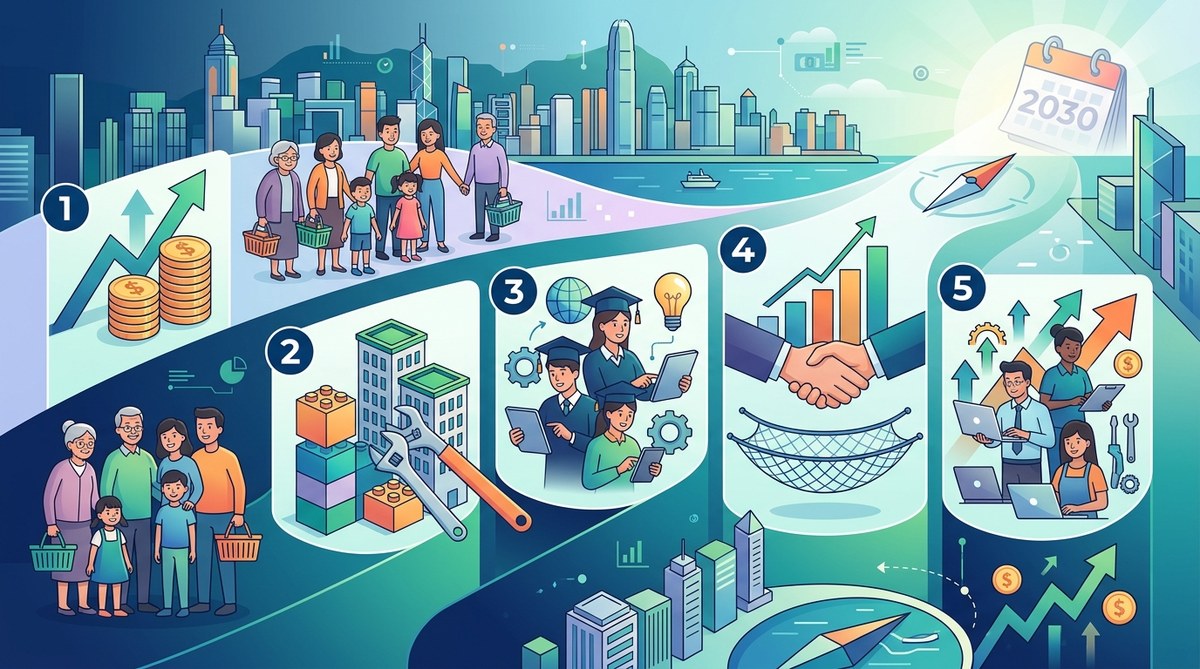
3 Steps to Use This Data for Better Policy Advocacy
If you are a researcher, policy analyst, or journalist working on Hong Kong poverty inequality in 2026, the data can feel overwhelming. But you can turn it into action. Here is a straightforward process.
-
Start with the poverty line methodology. Understand how the official poverty line is calculated. It is based on 50 percent of the median household income, adjusted for household size. That means it moves with the economy. When median income rises, the line moves up too. This can hide progress if incomes at the bottom are stagnant. Always check the raw numbers behind the rate.
-
Cross reference poverty data with the Social Development Index. The SDI covers more than income. It tracks health, education, housing, social participation, and environmental quality. A district may have a moderate poverty rate but very low scores on health access or housing quality. That tells you where to focus advocacy. The Social Development Index reveals hidden inequality patterns that income data alone cannot show.
-
Use district level breakdowns. Hong Kong’s average numbers hide extreme local variation. Poverty in Sham Shui Po looks very different from poverty in Southern District. When you report or advocate, cite the specific districts. It makes the problem real and actionable.
Common Traps in Interpreting Poverty Data
Even well meaning analysts can get tripped up by common mistakes. Here are a few to watch for.
- Mistaking the poverty rate for the absolute number. If the rate stays the same but the population grows, more people are actually in poverty. Always check both.
- Ignoring housing costs. Hong Kong’s poverty line is based on pre intervention income (before welfare and housing subsidies). But housing is the biggest expense for low income families. Post housing poverty rates are significantly higher.
- Comparing years without adjusting for inflation. A dollar in 2016 is not the same as a dollar in 2026. Always use real (inflation adjusted) figures.
Here is a table that summarizes the most frequent mistakes and how to fix them.
| Common Mistake | Why It Is Misleading | Better Approach |
|---|---|---|
| Using only the headline poverty rate | Hides changes in population size and severity | Report both the rate and the total number of people |
| Ignoring housing costs | Understates the true burden on low income families | Look at post housing poverty data from the government |
| Comparing nominal incomes across years | Inflation makes nominal comparisons useless | Use real incomes adjusted for CPI |
| Treating all poor households the same | Poverty affects elderly, children, and working adults differently | Break down data by age, household type, and district |
| Focusing only on income | Poverty is multidimensional | Use the Social Development Index for a fuller picture |
Why the Social Development Index Matters More Than Ever
The traditional way of measuring poverty focuses on income. But income is only one part of the story. Two households can have the same income and face very different realities depending on their health, housing quality, access to services, and social support networks.
That is where the Social Development Index becomes essential. It tracks 20 plus indicators across multiple domains, including health, education, housing, and social welfare. When you overlay the SDI with poverty data, patterns emerge. Some districts with moderate income poverty have very low SDI scores due to overcrowded housing or limited access to healthcare.
For journalists and advocates, the SDI offers a richer narrative. It moves the conversation beyond dollars and cents and toward the lived experience of poverty. It also helps identify which policy interventions might have the greatest impact. For example, if a district has high poverty and poor health scores, investing in community health centers could be more effective than cash transfers alone.
“Income data tells you who is struggling financially, but the Social Development Index tells you why they are struggling and what kind of support they actually need. That distinction is critical for designing policies that work.” — Dr. Karen Lam, social policy researcher at the University of Hong Kong
To see how the SDI has changed over time and what it means for the future, read our piece on tracking two decades of social change through Hong Kong’s development index.
A Broader View of the Problem
Hong Kong poverty inequality in 2026 is not just about low wages. It is about the cost of living crisis, the lack of affordable housing, the erosion of social mobility, and the aging population. These forces reinforce each other.
When housing costs consume 50 percent or more of a household’s income, there is little left for healthcare, education, or savings. Children grow up in cramped spaces with fewer opportunities to study. Parents work multiple jobs and have less time for family. Health problems go untreated because a doctor visit feels unaffordable. Over time, these cumulative stresses create a poverty trap that is hard to escape.
The data shows that intergenerational mobility in Hong Kong has declined. Children from low income families are less likely to move up the economic ladder than they were a generation ago. That is a worrying sign for the city’s future. For a closer look at this trend, see our report on tracking Hong Kong’s intergenerational earnings mobility and whether children are better off than their parents.
What the Data Means for Policy in 2026
Policymakers in Hong Kong have access to some of the best economic data in the world. The challenge is not a lack of information. It is a lack of political will and coordination across departments.
The 2026 poverty line revision was a step forward. It acknowledged that the cost of living has risen and adjusted the threshold accordingly. But adjusting the line does not reduce poverty. It only changes how we measure it. The real work lies in policies that increase affordable housing supply, raise wages at the bottom, strengthen the social safety net, and invest in public services.
Some advocates have called for a universal basic income pilot. Others argue for expanding public housing and rent control. Still others want to see higher minimum wages and stronger labor protections. Each approach has trade offs. But the current trajectory, where growth benefits a narrow slice of the population, is not sustainable.
The conversation about Hong Kong poverty inequality in 2026 is ultimately a conversation about values. What kind of society does Hong Kong want to be? One where a rising tide lifts only yachts, or one where everyone has a fair shot at a decent life?
Where We Go From Here
The numbers do not have to be depressing. They can be a call to action. For researchers, they are a tool for rigorous analysis. For journalists, they are a source of stories that need to be told. For advocates, they are evidence that can drive change.
The Social Indicators of Hong Kong platform exists to make this data accessible and usable. Whether you are writing a policy brief, preparing a news article, or preparing a community presentation, the statistics are here for you. Use them. Share them. Question them. And push for the kind of evidence based policies that can actually move the needle on poverty.
The gap between Hong Kong’s richest and poorest does not have to keep growing. With the right data and the right action, it is possible to build a more inclusive economy. The first step is understanding the problem clearly. That is what these numbers help us do.
Post Comment