
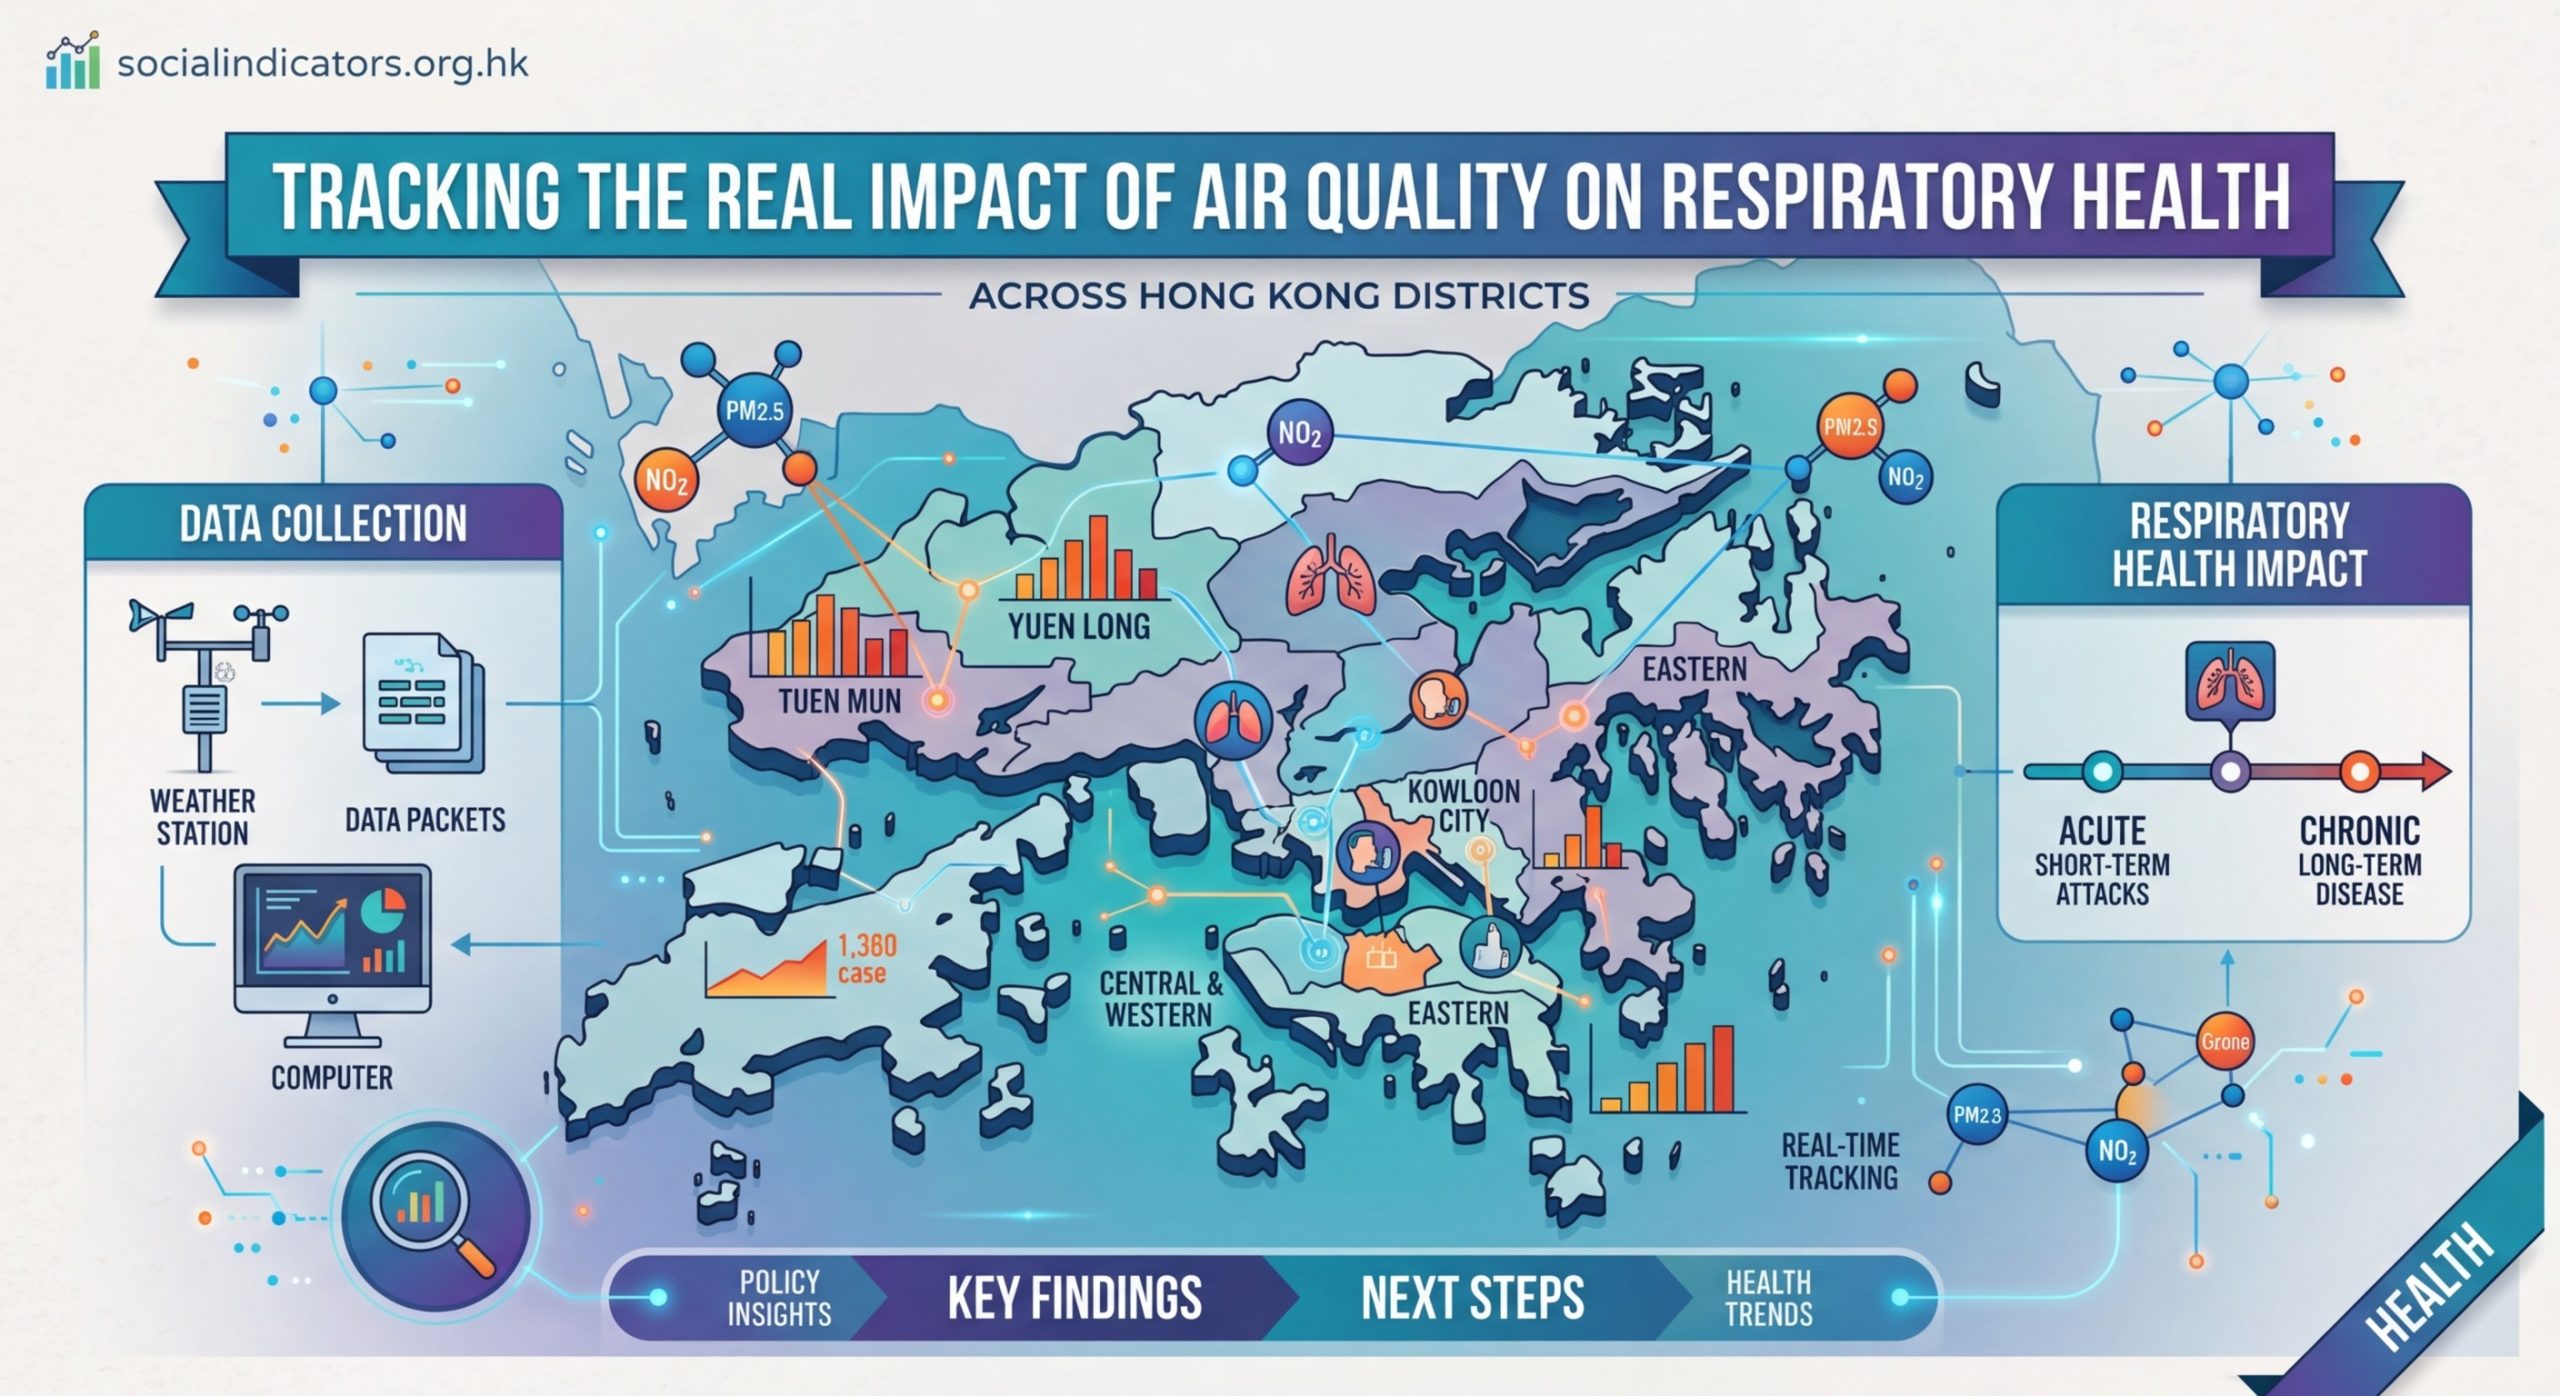
Tracking the Real Impact of Air Quality on Respiratory Health Across Hong Kong Districts
Breathing shouldn’t feel like work. Yet for many Hong Kong residents, the simple act of inhaling can trigger coughing, wheezing, or worse. Air pollution doesn’t affect everyone equally across our city. Some districts carry heavier burdens than others, and understanding these patterns can help you protect your family’s health.
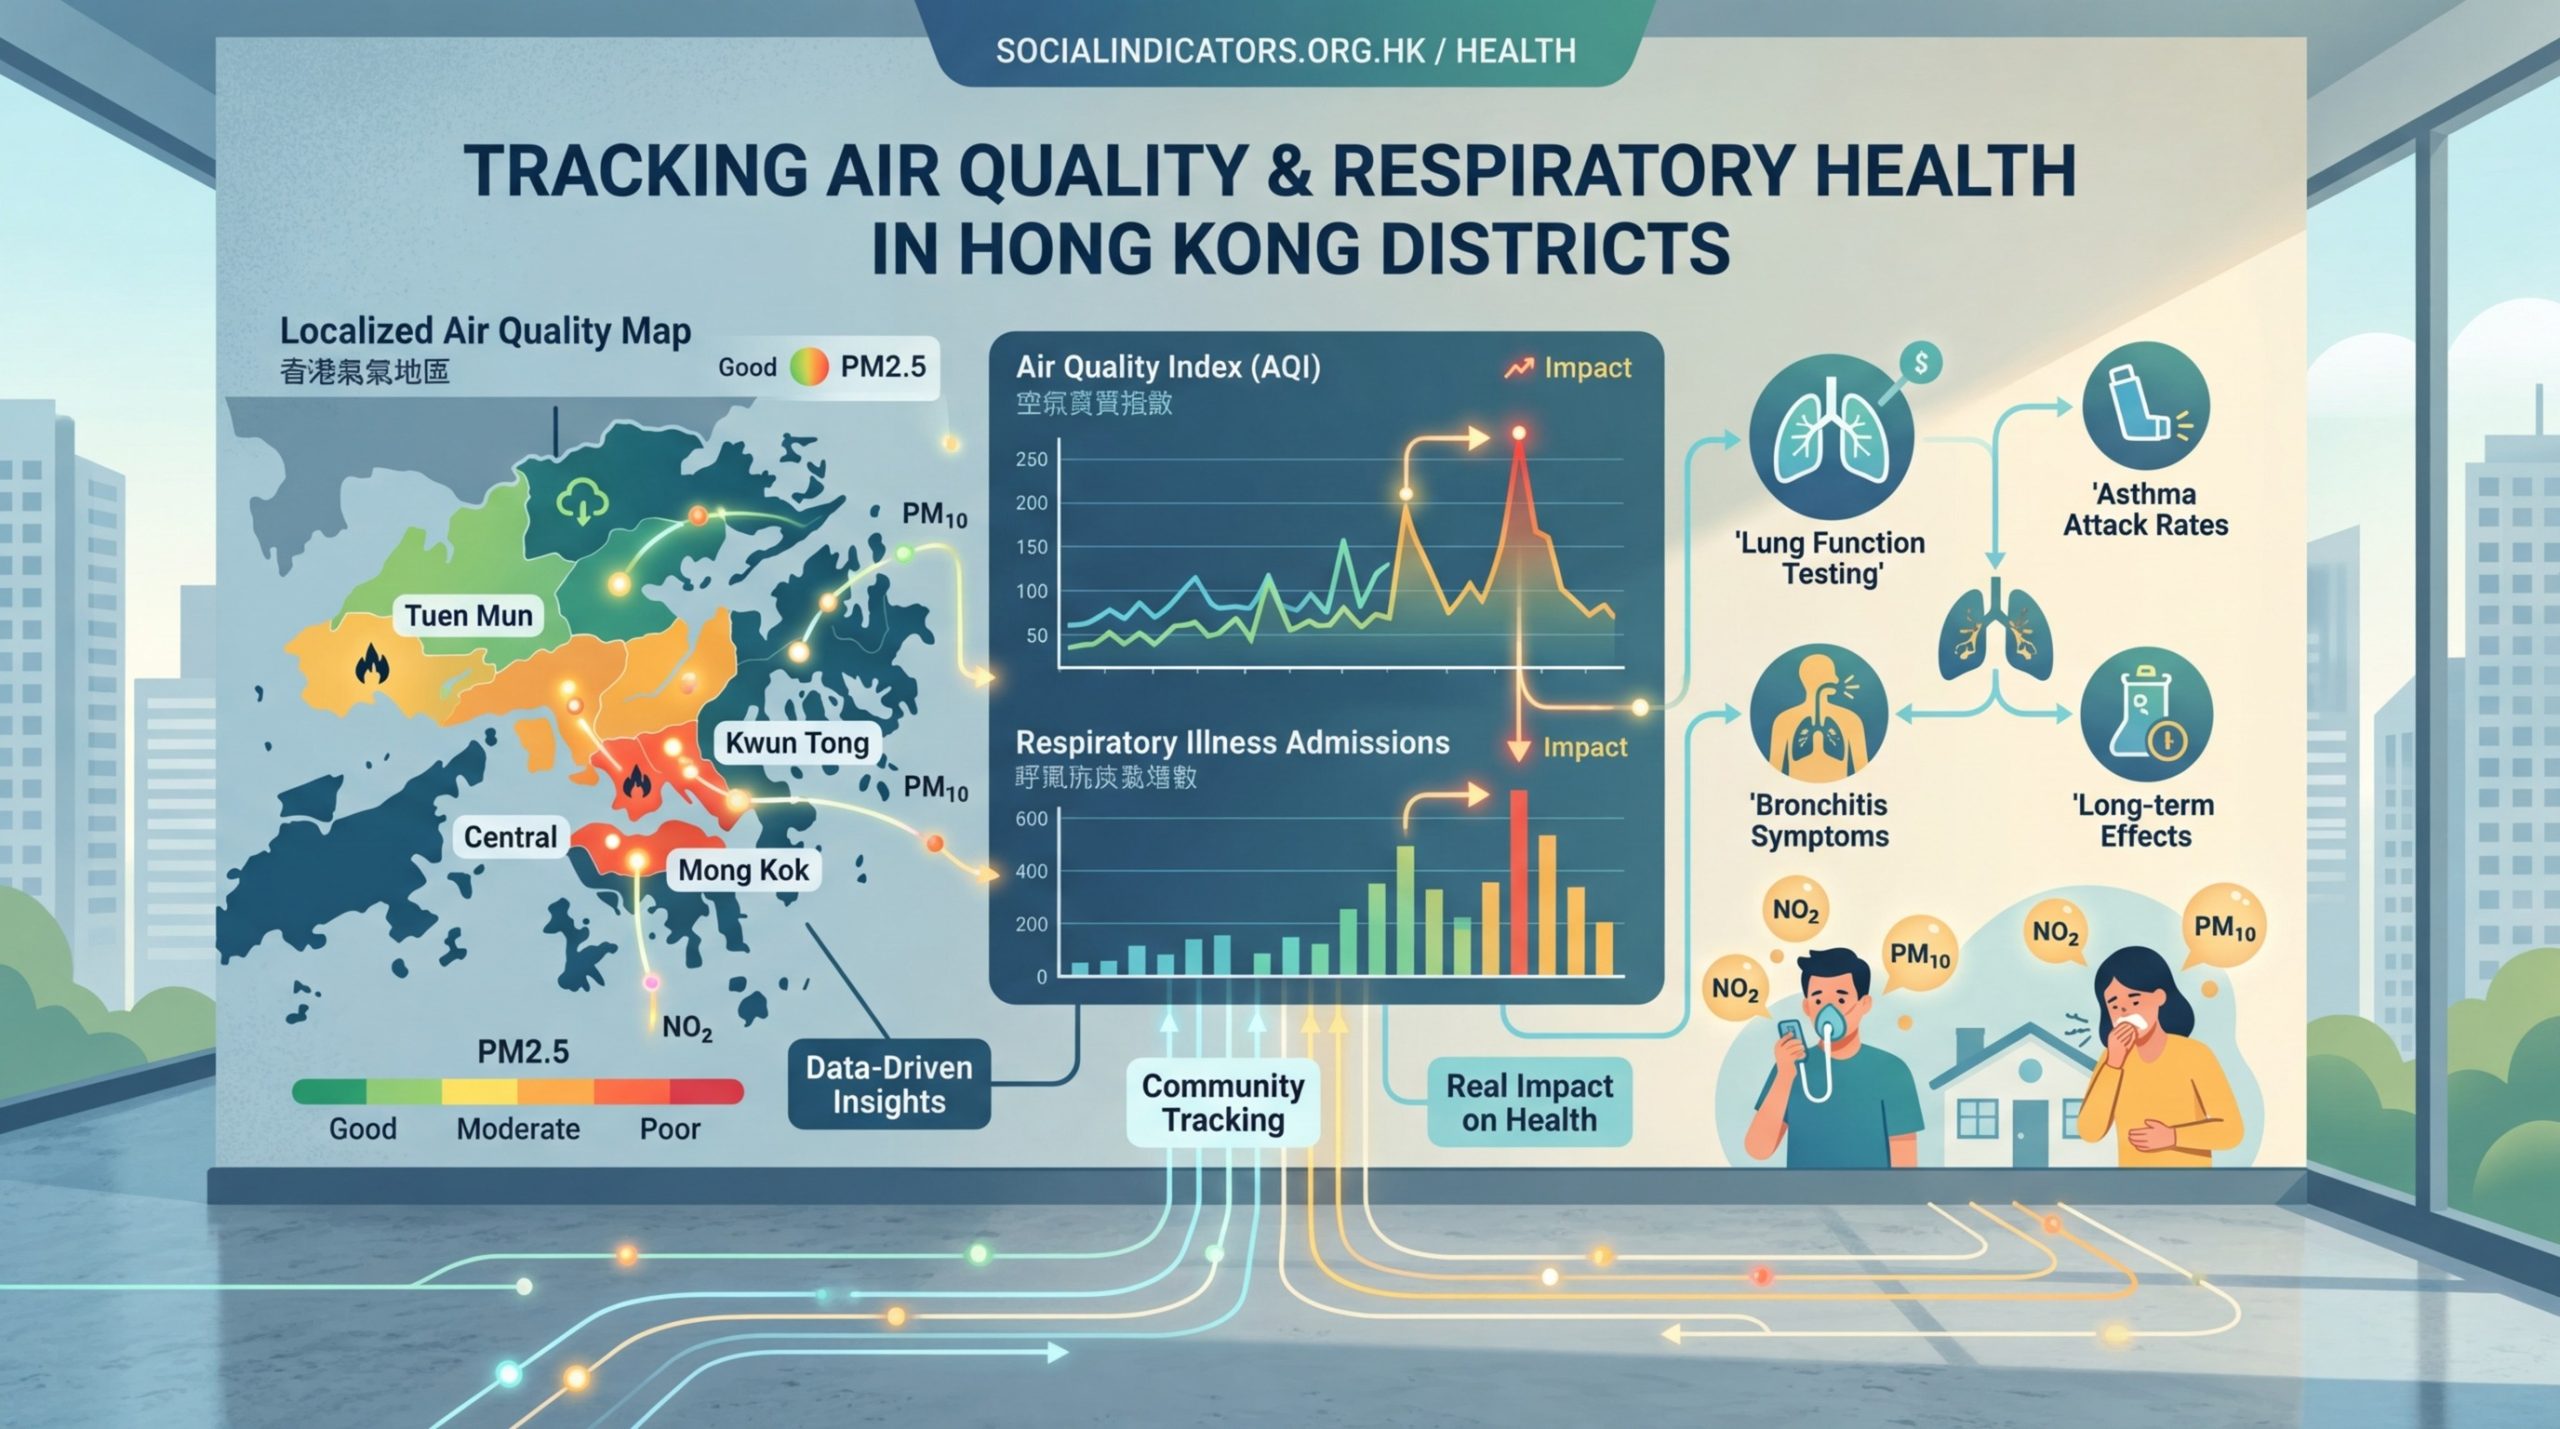
Air quality varies dramatically across Hong Kong districts, directly impacting respiratory health outcomes. Roadside areas show PM2.5 levels 40% higher than general stations, correlating with increased hospital admissions for asthma and [chronic obstructive pulmonary disease](https://www.cdc.gov/copd/index.html). Understanding your district’s air quality patterns helps you make informed decisions about outdoor activities, living locations, and protective measures for vulnerable family members.
Understanding the connection between pollution and lung function
Your lungs interact with Hong Kong’s air every single moment. When pollution levels rise, tiny particles slip past your body’s natural defenses. These microscopic invaders trigger inflammation deep inside your respiratory system.
PM2.5 particles measure just 2.5 micrometers in diameter. That’s roughly 30 times smaller than a human hair. Their size lets them penetrate deep into lung tissue, reaching the alveoli where oxygen enters your bloodstream.
Research from Hong Kong hospitals shows clear patterns. When PM2.5 concentrations exceed 50 micrograms per cubic meter, emergency room visits for respiratory problems jump by 12 to 18 percent within 48 hours.
Children face particular risks. Their lungs are still developing, and they breathe faster than adults relative to their body size. A child playing outside during high pollution days inhales proportionally more contaminated air than an adult walking the same route.
Elderly residents with existing conditions face compounded challenges. Chronic obstructive pulmonary disease patients experience more frequent exacerbations when air quality deteriorates. Asthma sufferers need their rescue inhalers more often during pollution spikes.
District by district respiratory health patterns
Hong Kong’s geography creates pollution hotspots. Tall buildings trap pollutants at street level. Traffic congestion concentrates exhaust fumes. Industrial activities add their own contributions.
Central and Western District residents face roadside pollution from constant traffic flow. Monitoring stations there record PM2.5 levels averaging 35 to 45 micrograms per cubic meter during typical weekdays.
Kwun Tong and Kwai Tsing show elevated readings due to industrial operations and port activities. These working districts see pollution levels 20 to 30 percent higher than residential areas in the New Territories.
Sham Shui Po presents a complex picture. Dense housing, narrow streets, and heavy vehicle traffic create a perfect storm for poor air circulation. Residents there report respiratory symptoms at rates 25 percent above the city average.
The following table shows how different pollution sources affect specific health outcomes:
| Pollution Source | Primary Pollutant | Most Affected Areas | Common Respiratory Impact |
|---|---|---|---|
| Vehicle exhaust | NO2, PM2.5 | Central, Mong Kok | Asthma attacks, bronchitis |
| Industrial emissions | SO2, PM10 | Kwun Tong, Tsuen Wan | COPD flare-ups, reduced lung function |
| Construction dust | PM10, PM2.5 | Development zones | Coughing, throat irritation |
| Cross-border pollution | Ozone, PM2.5 | Northern districts | Chest tightness, breathing difficulty |
Interestingly, some outlying areas don’t guarantee clean air. Tung Chung experiences pollution drifts from mainland industrial regions. Prevailing winds carry contaminated air across the border, affecting residents who chose the area specifically for better air quality.
Measuring real health outcomes across communities
Hospital admission data tells a compelling story. Between 2018 and 2022, respiratory-related hospitalizations increased 15 percent in districts with consistently poor air quality readings.
Pediatric asthma cases show the starkest correlation. Districts with annual average PM2.5 above 30 micrograms per cubic meter report childhood asthma rates 40 percent higher than cleaner areas.
School absence rates provide another indicator. Primary schools in Kwun Tong and Sham Shui Po record 20 percent more respiratory illness absences compared to schools in Sai Kung or Tai Po.
Medical professionals treating respiratory conditions note that patient symptoms often worsen during pollution episodes. Medication effectiveness decreases when patients continuously breathe contaminated air. Prevention through air quality awareness becomes as important as treatment protocols.
Lung function testing reveals measurable differences. Adults who have lived in high-pollution districts for more than a decade show reduced forced expiratory volume compared to those in cleaner areas. The difference averages 8 to 12 percent, enough to impact daily activities and exercise capacity.
Practical steps to protect your respiratory health
You can’t control citywide pollution levels, but you can manage your exposure. Start by checking air quality indexes before planning outdoor activities.
- Download a reliable air quality app that provides district-specific readings and forecasts
- Schedule outdoor exercise for early morning hours when pollution typically reaches daily lows
- Keep windows closed during high pollution alerts and use air purifiers with HEPA filters indoors
- Create a safe room in your home with enhanced filtration for vulnerable family members during severe pollution episodes
- Teach children to recognize symptoms like unusual breathlessness or chest tightness and report them immediately
Timing matters significantly. Morning rush hour from 7:30 to 9:30 AM creates pollution spikes near major roads. Evening rush hour from 5:30 to 7:30 PM produces similar effects. Walking routes one or two blocks away from main thoroughfares can reduce your exposure by 30 to 40 percent.
Indoor air quality deserves equal attention. Cooking with gas stoves releases nitrogen dioxide. Cleaning products emit volatile organic compounds. Poor ventilation traps these pollutants inside your home where you spend most of your time.
Consider these protective measures for different family members:
- Infants and toddlers: Use air purifiers in sleeping areas, limit stroller time near busy roads, choose parks away from traffic
- School-age children: Monitor school air quality policies, provide N95 masks for high pollution days, encourage indoor activities during alerts
- Working adults: Request flexible hours to avoid commuting during peak pollution, advocate for office air filtration, take breaks in filtered indoor spaces
- Elderly family members: Schedule medical appointments for morning hours, maintain medication compliance, install air quality monitors at home
- Pregnant women: Minimize outdoor exposure during third trimester, use purifiers in main living spaces, stay hydrated to help body clear toxins
Reading the warning signs your body sends
Your respiratory system communicates clearly when pollution affects it. Learning these signals helps you respond before minor irritation becomes serious illness.
Persistent morning cough that wasn’t there before suggests nighttime exposure to indoor or outdoor pollutants. Mucus production increases as your lungs try to trap and expel particles.
Shortness of breath during activities you previously handled easily indicates reduced lung capacity. Inflammation narrows airways, forcing your respiratory muscles to work harder.
Chest tightness or pressure, especially after time outdoors, signals airway constriction. This symptom requires medical attention if it persists or worsens.
Frequent respiratory infections point to compromised immune function in your lungs. Pollution damages the protective mucus layer and cilia that normally trap pathogens.
Children may not articulate symptoms clearly. Watch for behavioral changes like avoiding outdoor play, complaining of tiredness, or breathing through their mouth more often.
Making informed decisions about where to live
Location choices significantly impact long-term respiratory health. Families planning moves should weigh air quality alongside other factors like schools and commute times.
Request historical air quality data for specific addresses. General district averages don’t tell the whole story. A building next to a major road faces different conditions than one three blocks inland.
Visit potential neighborhoods at different times. Morning and evening pollution patterns vary. Weekend readings often differ substantially from weekday levels.
Check for nearby pollution sources. Bus terminals, taxi stands, loading zones, and idling areas create localized hotspots. Buildings downwind from these sources experience higher exposure.
Consider building height and surroundings. Ground-floor units near busy streets face maximum exposure. Higher floors above the street canyon effect breathe cleaner air. Buildings with good setbacks from roads provide buffer zones.
Green spaces offer more than aesthetics. Trees and vegetation filter particulates and produce oxygen. Districts with parks and tree-lined streets show measurably better air quality.
Common mistakes that increase your pollution exposure
Many well-intentioned actions accidentally increase respiratory risk. Recognizing these errors helps you adjust your habits.
| Mistake | Why It’s Harmful | Better Alternative |
|---|---|---|
| Exercising near busy roads | Increased breathing rate pulls more pollutants deep into lungs | Choose parks or waterfront paths away from traffic |
| Opening windows during rush hour | Invites peak pollution directly into living spaces | Ventilate early morning or late evening when traffic subsides |
| Ignoring air quality alerts | Assumes all days carry equal risk | Check daily readings and adjust activities accordingly |
| Using only surgical masks | These don’t filter PM2.5 particles effectively | Wear properly fitted N95 or KN95 masks during high pollution |
| Relying on indoor plants for air cleaning | Plants help minimally compared to mechanical filtration | Invest in quality HEPA air purifiers for main living areas |
Assuming expensive neighborhoods automatically mean better air quality leads to poor decisions. Some luxury developments sit in pollution hotspots due to proximity to highways or commercial zones.
Believing short-term exposure doesn’t matter underestimates cumulative effects. Each pollution episode adds to your lifetime burden. Consistent small exposures accumulate into significant health impacts.
Waiting for government action alone delays personal protection. Policy changes take time. Individual protective measures provide immediate benefits while broader solutions develop.
Technology and tools for monitoring your environment
Modern technology puts air quality data in your pocket. Multiple apps provide real-time readings, forecasts, and health recommendations.
Government monitoring stations offer official data but limited coverage. Supplementing with community sensors gives hyperlocal information. Some residential buildings now install their own monitors in common areas.
Personal air quality monitors have become affordable. Devices measuring PM2.5, PM10, and volatile organic compounds cost less than a month of dining out. They reveal pollution patterns specific to your home and neighborhood.
Smart home integration lets you automate responses. Air purifiers can activate automatically when sensors detect elevated pollution. Ventilation systems can close intake vents during external pollution spikes.
Wearable devices tracking respiratory rate and blood oxygen saturation help you notice subtle impacts. Patterns showing decreased oxygen levels or increased breathing rates during certain activities or locations guide behavioral adjustments.
Building community awareness and collective action
Individual protection matters, but community-level changes create lasting improvements. Neighborhood groups advocating for traffic calming measures reduce local pollution sources.
School parent associations can push for air quality monitoring in classrooms and policy changes limiting outdoor activities during pollution alerts. Children spend significant time in school environments, making this advocacy particularly impactful.
Building management committees can upgrade ventilation systems and install filtration in common areas. Collective action spreads costs while benefiting all residents.
Local district councils respond to constituent pressure. Presenting health data alongside air quality readings makes compelling cases for green space development, traffic management changes, and pollution source regulation.
Social media groups sharing real-time air quality information and health impacts create awareness. When neighbors understand connections between pollution episodes and their symptoms, they become advocates for change.
Your lungs deserve clean air every day
The air you breathe shapes your health more than almost any other environmental factor. Hong Kong’s varying air quality across districts means your location choices directly impact your respiratory wellbeing.
Data shows clear connections between pollution levels and health outcomes. Armed with this knowledge, you can make informed decisions protecting yourself and your family. Check air quality before heading outside. Choose living locations considering pollution patterns. Advocate for cleaner air in your community.
Small daily actions compound into significant long-term benefits. Your lungs work tirelessly every moment. Give them the cleanest air possible, and they’ll serve you well for decades to come.

Post Comment