
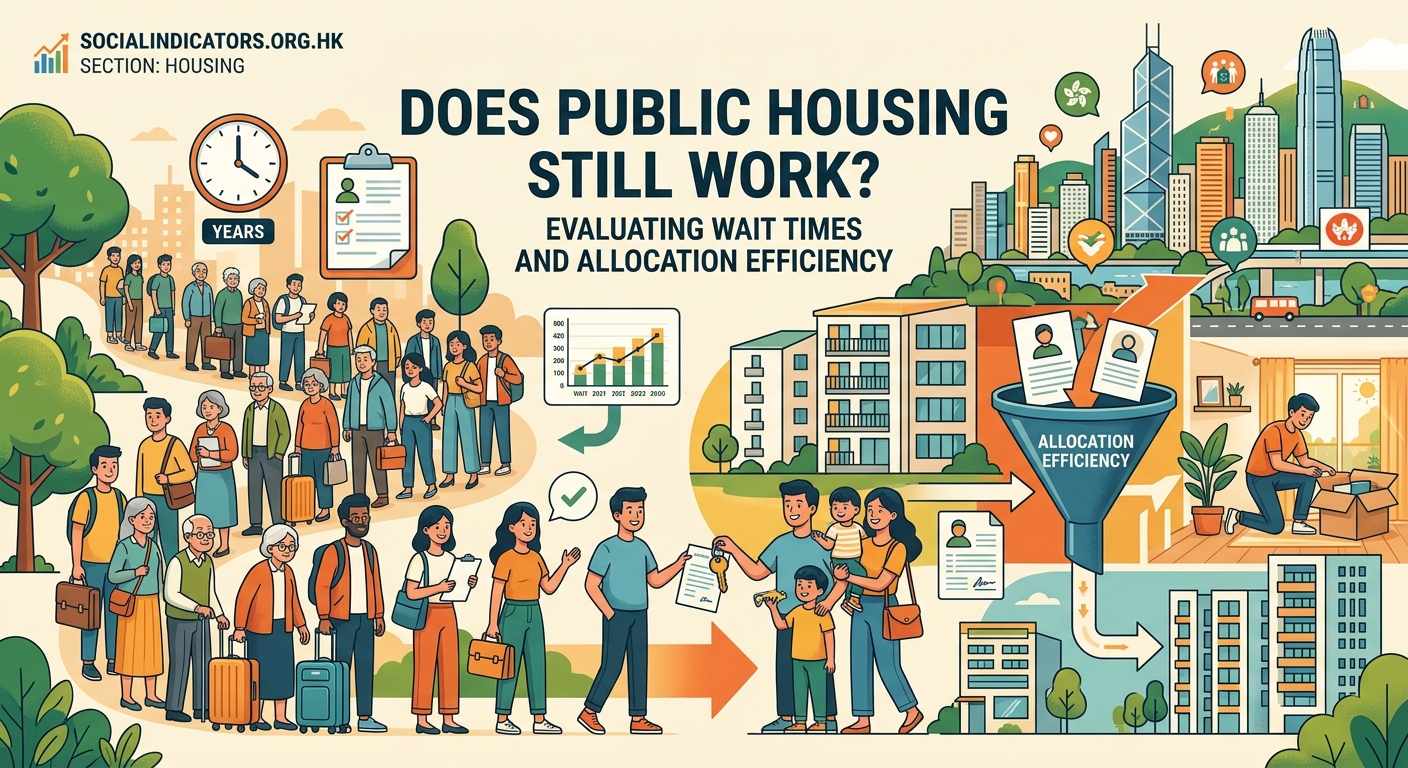
Does Public Housing Still Work? Evaluating Wait Times and Allocation Efficiency
The average wait time for public housing in Hong Kong has stretched beyond five years, affecting hundreds of thousands of families. What was once a model system now faces mounting pressure from demographic shifts, land constraints, and evolving household structures. Understanding where the bottlenecks occur matters for anyone working to improve housing policy or advocating for vulnerable populations.
Public housing wait times in Hong Kong have increased significantly over the past decade, driven by supply shortages and changing demand patterns. Efficiency metrics reveal systemic challenges in land allocation, construction timelines, and matching mechanisms. Policy researchers need granular data on application processing, unit turnover rates, and demographic trends to propose evidence-based reforms that address both immediate backlogs and long-term sustainability.
Why Wait Times Have Climbed Steadily
Public housing applications surged after the 2008 financial crisis. Economic uncertainty pushed more households into the applicant pool. At the same time, construction output failed to keep pace with demand growth.
The Housing Authority reports that general applicants now wait an average of 5.6 years. Elderly one-person applicants face slightly shorter timelines at around 3.4 years. These figures represent medians, meaning half of all applicants wait even longer.
Several structural factors drive these delays:
- Limited land supply for new developments
- Lengthy statutory planning and approval processes
- Rising construction costs that constrain project feasibility
- Aging existing stock requiring redevelopment rather than simple maintenance
- Competing land use priorities across government departments
Each factor compounds the others. When land takes three years to rezone, construction timelines extend automatically. When existing estates need demolition and rebuilding, temporary rehousing creates additional demand pressure.
Breaking Down the Allocation Process
Understanding efficiency requires mapping how applications move through the system. The process involves multiple checkpoints, each introducing potential delays.
- Application submission and initial vetting to confirm eligibility based on income, assets, and residency requirements
- Waiting list management where applicants receive priority scores based on household composition and special circumstances
- Unit matching when vacancies arise or new developments complete, considering location preferences and family size
- Final verification of eligibility before offer letters go out, including home visits and document reviews
- Acceptance and move-in coordination, which can take several weeks depending on applicant circumstances
Each stage generates data that reveals system performance. Application processing times average 4 to 6 weeks under normal conditions. Verification stages take longer, especially when applicants need to gather additional documentation or resolve discrepancies.
The matching phase presents the biggest challenge. Applicants often reject initial offers due to location concerns, building age, or flat size. Each rejection cycles them back into the queue, extending their personal wait time and reducing overall system efficiency.
Measuring Efficiency Beyond Simple Wait Times
Public housing wait times and efficiency require multiple metrics to capture system performance accurately. Wait time alone tells an incomplete story.
| Metric | What It Reveals | Current Challenge |
|---|---|---|
| Application-to-offer ratio | How many applications result in successful placements | High rejection rates for certain flat types |
| Unit turnover rate | How quickly vacancies become available for reallocation | Aging tenant population reduces natural turnover |
| Construction completion variance | Gap between planned and actual delivery dates | Projects frequently delayed 12 to 18 months |
| Allocation acceptance rate | Percentage of offers accepted on first attempt | Location mismatches drive refusals |
| Processing time per stage | Bottlenecks in verification or matching phases | Verification backlog during peak periods |
These metrics help identify where interventions would have the greatest impact. If acceptance rates lag, the matching algorithm needs refinement. If construction variance runs high, project management requires attention.
Efficiency also depends on how well the system serves different applicant categories. Single elderly applicants move faster through the queue but may face different quality-of-life challenges in allocated units. Families with children need proximity to schools and services, adding complexity to matching.
Supply-Side Constraints That Shape Performance
No discussion of efficiency can ignore supply limitations. Hong Kong produces roughly 15,000 to 20,000 public housing units annually. Demand consistently outstrips this figure.
The government’s long-term housing strategy targets higher production volumes. Implementation faces real obstacles. Suitable land parcels require years to identify, acquire, and prepare. Environmental assessments, traffic studies, and community consultations extend timelines further.
Redevelopment of older estates offers one path to increased supply. Estates built in the 1960s and 1970s now require major renovations or complete rebuilding. Redevelopment increases density and improves living conditions but displaces current residents temporarily, creating circular demand.
The challenge isn’t just building more units. It’s building the right units in the right locations while maintaining quality standards and managing existing stock. Every policy choice involves tradeoffs between speed, cost, and livability.
Private-public partnerships have emerged as potential accelerators. Some proposals suggest leveraging private sector construction capacity with government land and financing. Implementation details remain contentious, particularly around affordability guarantees and long-term ownership structures.
Demand-Side Dynamics and Demographic Shifts
Application patterns have shifted noticeably over the past 15 years. Non-elderly one-person applications increased substantially, reflecting changing household formation patterns and delayed marriage trends.
This demographic shift strains a system designed primarily for families. Smaller households need different unit configurations. Matching algorithms optimized for family-sized flats struggle with efficiency when single-person applications dominate certain segments.
Elderly applicants present another distinct pattern. As Hong Kong’s population ages, more seniors apply for public housing after family structures change or financial circumstances deteriorate. The system offers priority allocation for elderly applicants, but concentrated demand in this category still creates localized bottlenecks.
Income and asset limits also shape the applicant pool. These thresholds receive periodic adjustments to reflect economic conditions. When limits rise, more households qualify, increasing applications. When limits hold steady during inflationary periods, fewer households exit the queue through income growth, slowing turnover.
Data Gaps That Hinder Policy Analysis
Researchers analyzing public housing performance face significant data limitations. Publicly available statistics provide aggregate figures but lack granular breakdowns needed for sophisticated analysis.
Key data gaps include:
- Detailed rejection reasons beyond broad categories
- Geographic distribution of applicants versus available units
- Longitudinal tracking of individual applicant journeys through the system
- Comparative performance across different estate types and locations
- Cost efficiency metrics per unit delivered
These gaps make it difficult to assess which policy interventions would deliver the best return. Without rejection reason details, improving the matching algorithm becomes guesswork. Without geographic data, planners can’t optimize new development locations.
Some information remains restricted due to privacy concerns or administrative capacity. Balancing transparency with confidentiality requires careful data governance frameworks that currently don’t exist in fully developed form.
International Comparisons and Alternative Models
Hong Kong’s public housing system serves a larger proportion of its population than most global cities. Roughly 30% of residents live in public rental housing, with another 15% in subsidized home ownership schemes.
Singapore offers an interesting comparison point. Its Housing Development Board provides housing for over 80% of the population through a mix of rental and ownership programs. Wait times there average 3 to 4 years for new flats, though resale options offer faster alternatives.
The key difference lies in land availability and political structure. Singapore controls land supply more directly and faces fewer competing demands on available parcels. Its integrated planning approach links housing, transportation, and employment centers from initial design stages.
European social housing models typically serve smaller population shares but offer lessons in allocation mechanisms. Vienna’s system emphasizes mixed-income developments and transparent point-based allocation. Copenhagen uses cooperative housing structures that blend private and public elements.
Adapting these models to Hong Kong’s context requires careful consideration of local constraints. What works in Vienna may not translate to a city with Hong Kong’s density, land scarcity, and governance structure.
Technology and Process Innovation Opportunities
Digital tools offer potential efficiency gains across multiple process stages. Online application systems reduce paperwork and speed initial processing. Automated eligibility checks catch errors earlier, reducing back-and-forth with applicants.
More sophisticated matching algorithms could improve acceptance rates. Machine learning models trained on historical data might predict which applicants will accept which unit types, optimizing offer sequences. Geographic preference modeling could reduce location-based rejections.
Blockchain-based verification systems could streamline document authentication. If income, employment, and residency records existed in secure distributed ledgers, verification stages could complete in days rather than weeks.
These innovations require significant upfront investment and careful implementation. Legacy systems integration poses technical challenges. Staff training and change management demand resources. Privacy and security considerations constrain some approaches.
Policy Levers for Improving System Performance
Researchers and advocates often focus on supply expansion as the primary solution. While necessary, supply increases alone won’t optimize system efficiency. Several complementary policy adjustments could reduce wait times and improve allocation outcomes.
Adjusting priority criteria might better reflect current housing needs. The existing points system dates from an era with different demographic patterns. Recalibrating weights for household types, special circumstances, and waiting duration could improve matching efficiency.
Expanding location choice flexibility could reduce rejection rates. Currently, applicants select districts but have limited say in specific estates. A preference ranking system might allow more nuanced matching while maintaining fairness.
Interim housing options could ease pressure on the main queue. Transitional housing programs provide temporary accommodation while applicants wait for permanent allocation. These programs serve a small fraction of waitlisted households but could scale with appropriate resources.
Financial incentives for accepting less popular units might improve turnover. Rent discounts or priority transfer rights could make older estates or remote locations more attractive, freeing up high-demand units for households with fewer alternatives.
The Role of Transparency in System Trust
Public confidence in allocation fairness affects system performance. When applicants trust the process, they engage more constructively. When suspicion grows, rejection rates climb and complaints multiply.
Transparency measures build trust. Publishing detailed statistics on allocation patterns, wait times by category, and rejection reasons helps applicants understand their position. Regular reporting on construction progress and pipeline projects sets realistic expectations.
Independent audits of allocation decisions provide external validation. Periodic reviews by academic researchers or civil society organizations can identify bias or inefficiency that internal processes might miss.
Applicant feedback mechanisms create channels for continuous improvement. Surveys after allocation offers reveal pain points in the process. Complaint analysis highlights recurring issues that warrant systematic fixes.
Balancing Speed and Quality in Housing Delivery
Pressure to reduce wait times can create incentives to cut corners. Faster construction might compromise building quality. Streamlined approvals might skip important safety or environmental checks.
Maintaining quality standards while improving efficiency requires careful process design. Some delays serve important purposes. Environmental impact assessments prevent problems that would be costly to fix later. Building inspections catch defects before occupancy.
The challenge lies in eliminating unnecessary delays without sacrificing essential safeguards. Process mapping can identify redundant approval stages or outdated requirements that no longer serve their original purpose.
International building standards offer benchmarks for quality expectations. Comparing Hong Kong’s requirements against Singapore, Tokyo, or London reveals where local rules exceed global norms and where they fall short.
What the Numbers Tell Us About Future Trajectories
Current trends suggest wait times will remain elevated without significant intervention. Demographic projections show continued household formation growth outpacing planned construction increases.
The government’s target of 330,000 public housing units over the next decade represents ambitious scaling. Achieving this goal requires maintaining annual production well above historical averages for a sustained period.
Even if construction targets are met, wait times may not fall proportionally. Pent-up demand from current long waitlists will absorb much of the new supply. Reaching equilibrium where annual supply matches annual demand will take years of sustained overproduction.
Climate change adds another variable. Rising temperatures increase construction costs through material requirements and worker safety measures. Extreme weather events can delay projects. Adaptation measures for existing stock require resources that might otherwise go to new construction.
Making Data Work for Better Outcomes
The path forward requires combining supply expansion with process optimization and better data utilization. Policy researchers can contribute by developing more sophisticated analytical frameworks that capture system complexity.
Simulation modeling could test policy interventions before implementation. Agent-based models might reveal how changes to priority scoring affect different applicant groups. Network analysis could optimize the geographic distribution of new developments.
Longitudinal studies tracking applicant experiences would provide insights that cross-sectional snapshots miss. Understanding how wait times affect household decisions, employment patterns, and wellbeing outcomes connects housing policy to broader social indicators.
Comparative research across cities facing similar challenges builds knowledge about what works. Hong Kong isn’t alone in struggling with housing affordability and supply constraints. Systematic comparison with Singapore, Tokyo, London, and Vienna could identify transferable solutions.
Regular performance benchmarking against clear targets creates accountability. If the system commits to specific wait time reductions or efficiency improvements, tracking progress becomes straightforward. Missed targets trigger analysis of root causes and corrective action.
Public housing represents one of Hong Kong’s most significant social investments. Getting allocation right affects hundreds of thousands of lives directly and shapes the city’s social fabric. The data exists to understand current performance. The analytical tools exist to identify improvements. What remains is the political will to implement changes and the patience to see long-term strategies through to completion.


Post Comment