
Measuring the Social Determinants of Health Through Integrated Cross-Sector Data
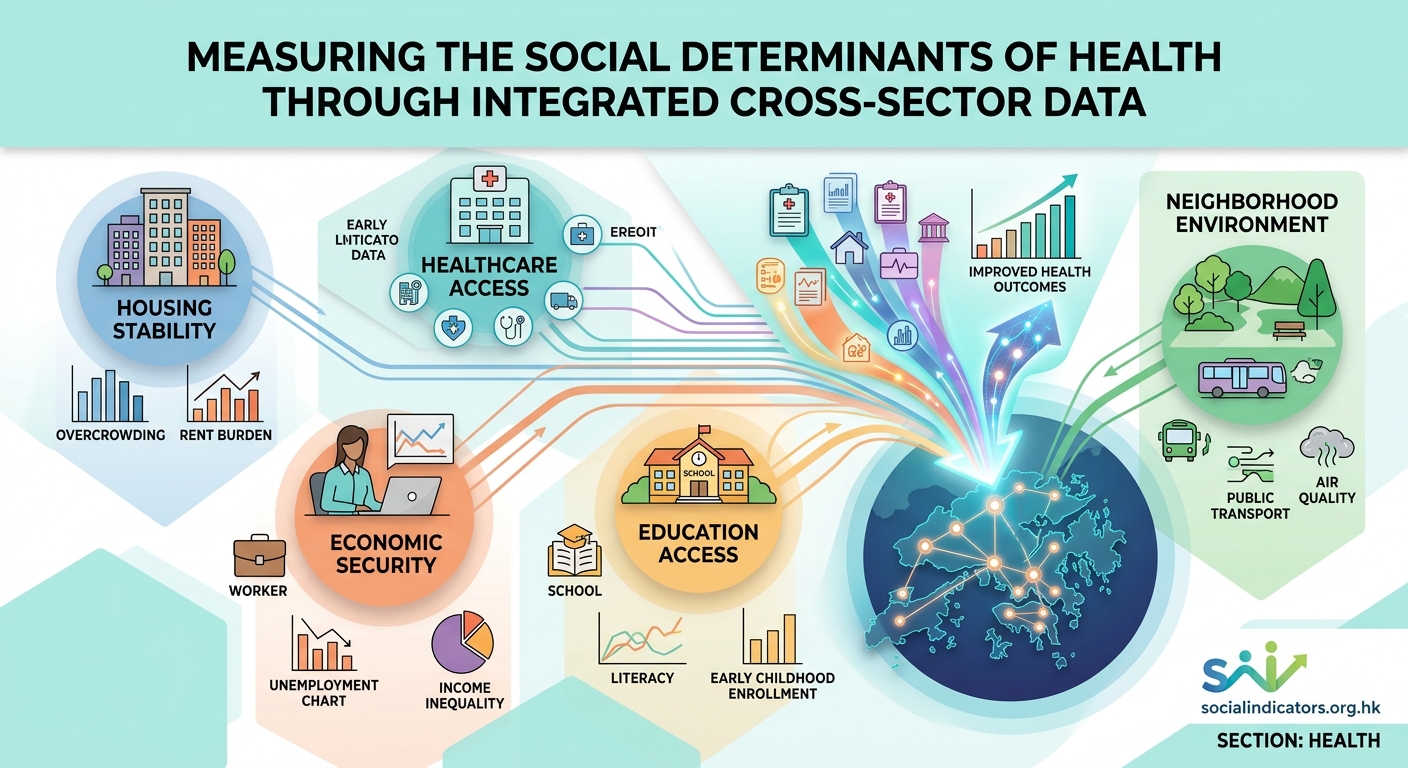
Health outcomes don’t happen in a vacuum. The conditions where people live, work, learn, and play shape their wellbeing far more than clinical care alone. Measuring social determinants of health means capturing data across housing, education, employment, transportation, and environment to understand what truly drives population health. For researchers and policymakers, this requires integrating information from multiple sectors that rarely share systems or vocabularies.
Measuring social determinants of health requires frameworks that integrate data from housing, education, employment, and environmental sources. Successful measurement combines standardized indicators with cross-sector data sharing agreements, geocoded analysis, and community input. This approach reveals how social conditions create health disparities and identifies intervention points for policy change and resource allocation.
Why traditional health data misses the bigger picture
Clinical records tell you what happened inside a hospital or clinic. Lab results, diagnoses, prescriptions. But they don’t explain why diabetes rates cluster in certain neighborhoods or why asthma admissions spike in specific zip codes.
Social determinants account for an estimated 80% of health outcomes. That includes stable housing, quality education, safe neighborhoods, reliable transportation, and economic opportunity. These factors operate outside the healthcare system yet profoundly influence who gets sick and who stays well.
Traditional health surveillance systems weren’t built to capture this broader context. They focus on individual behaviors and biological factors. They miss the structural conditions that shape those behaviors in the first place.
Measuring social determinants means looking upstream. It requires data from schools, housing authorities, environmental agencies, and labor departments. Each sector collects information differently, uses different definitions, and protects privacy through different regulations.
Building a cross-sector measurement framework
A robust framework starts with defining which determinants matter most for your population and health outcomes of interest. Different communities face different challenges. Urban areas might prioritize air quality and housing density. Rural regions might focus on transportation access and broadband connectivity.
The framework should specify:
- Which social determinants to measure and why
- Data sources for each determinant
- Standardized indicators and definitions
- Geographic units for analysis
- Temporal frequency of measurement
- Data sharing agreements and privacy protocols
“The most effective frameworks don’t try to measure everything. They focus on determinants with strong evidence links to priority health outcomes and where intervention is feasible.”
Start with existing data infrastructure when possible. Many jurisdictions already collect relevant information through administrative processes. School enrollment records, housing inspection databases, employment statistics, and transit ridership all contain useful signals about social conditions.
Core indicators across major determinant categories
Different determinant categories require different measurement approaches. Here’s how leading frameworks organize indicators:
| Determinant Category | Example Indicators | Common Data Sources |
|---|---|---|
| Economic Stability | Poverty rate, employment rate, housing cost burden | Census, labor statistics, housing authority |
| Education Access | High school graduation, early childhood enrollment, literacy rates | School districts, libraries, testing agencies |
| Healthcare Access | Insurance coverage, primary care availability, preventive care use | Claims data, provider directories, surveys |
| Neighborhood Environment | Air quality, green space access, walkability scores | Environmental monitoring, GIS analysis, planning departments |
| Social Context | Social cohesion, discrimination experiences, civic participation | Community surveys, voting records, organizational data |
The key is selecting indicators that are actionable. Measuring something you can’t influence wastes resources. Focus on determinants where policy or programmatic intervention can make a difference.
Practical steps for data collection and integration
Getting started with cross-sector measurement requires both technical infrastructure and relationship building. Here’s a proven sequence:
- Map existing data assets across sectors and identify gaps in coverage or quality.
- Establish data governance structures with clear roles for each partner organization.
- Develop data use agreements that specify permitted uses, privacy protections, and security requirements.
- Create a common data model with standardized definitions and coding schemes.
- Build technical infrastructure for secure data transfer and storage.
- Implement geocoding to link records across sources using geography as a common key.
- Develop validation processes to check data quality and identify errors or inconsistencies.
- Create analysis protocols that account for different update frequencies and coverage across sources.
The technical work is only half the challenge. Building trust between sectors takes time. Housing agencies and health departments often have different cultures, priorities, and constraints. Regular convenings help partners understand each other’s needs and limitations.
Geocoding as the backbone of integration
When different sectors use incompatible identifiers, geography becomes the universal link. Geocoding assigns spatial coordinates to records, allowing analysis by neighborhood, census tract, or custom boundaries.
Address-level geocoding provides the finest resolution. You can aggregate up to any geographic unit while preserving privacy through suppression rules for small counts. This enables analysis at the community scale where interventions actually happen.
Key geocoding considerations include:
- Address standardization to handle variations in formatting
- Geocoding accuracy rates and methods for handling unmatched records
- Privacy protections through geographic masking or aggregation
- Temporal alignment when addresses change over time
- Quality assurance to catch systematic errors
Many jurisdictions maintain master address databases that improve geocoding accuracy. Partnering with GIS teams in planning or tax assessment departments provides access to these resources.
Engaging communities in measurement design
Communities experiencing health inequities should help define what gets measured and how. Their lived experience reveals determinants that administrative data might miss. Residents know which intersections feel unsafe, which landlords ignore maintenance requests, and which neighborhoods lack grocery stores.
Community input shapes measurement in several ways. Participatory processes can identify priority determinants, validate indicator selection, interpret findings, and guide intervention design. This grounds technical work in local reality.
Methods for community engagement include:
- Focus groups with residents from priority populations
- Community advisory boards with decision-making authority
- Photovoice projects that document environmental conditions
- Participatory mapping of assets and challenges
- Community-based participatory research partnerships
This engagement takes time and resources. But it produces more relevant measures and builds trust that supports data sharing and intervention implementation.
Common pitfalls and how to avoid them
Even well-designed measurement efforts face predictable challenges. Recognizing these patterns helps you plan around them.
Data silos persist despite good intentions. Organizations hoard data due to privacy concerns, competitive dynamics, or simple inertia. Address this through clear governance structures, legal agreements that specify permitted uses, and early wins that demonstrate value.
Technical compatibility problems emerge. Different systems use incompatible formats, update cycles, and quality standards. Invest in data infrastructure early. Build translation layers rather than forcing everyone onto a single platform.
Analysis paralysis delays action. Perfect data never arrives. Start with available information and refine over time. Iterative improvement beats waiting for ideal conditions.
Findings sit unused on shelves. Measurement without action wastes resources. Build in dissemination and implementation planning from the start. Identify decision points where data can inform policy or resource allocation.
Privacy protections get overlooked. Integrating sensitive data creates risks. Implement robust security, minimize data retention, and ensure community oversight of data use.
Turning measurement into intervention
The point of measuring social determinants is improving them. Data should reveal intervention opportunities and track progress over time.
Effective use of measurement data includes:
- Identifying geographic hotspots for targeted intervention
- Detecting disparities across demographic groups
- Monitoring trends to catch emerging problems early
- Evaluating policy impacts through before-after comparisons
- Allocating resources based on community need
- Building political will through compelling visualization
Hong Kong’s Social Development Index demonstrates this approach in practice. By tracking indicators across economic, social, and environmental domains, the index makes social conditions visible and comparable over time. This creates accountability and informs budget priorities.
The best measurement systems create feedback loops. Data reveals problems, interventions respond, and subsequent measurement shows whether conditions improved. This cycle drives continuous improvement in population health.
Making data accessible to diverse users
Different audiences need different levels of detail. Policymakers want executive summaries. Researchers need methodology documentation. Community members want neighborhood-level maps.
A good dissemination strategy provides multiple entry points:
- Public dashboards with interactive visualizations
- Downloadable datasets for custom analysis
- Regular reports with key findings and trends
- Data stories that connect statistics to lived experience
- Technical documentation for replication
Accessibility means more than just publishing data. It requires plain language explanations, mobile-friendly design, and formats that work with assistive technology. Consider translation for communities that speak languages other than English.
Open data policies expand the reach and impact of measurement efforts. When researchers, journalists, and community organizations can access social determinants data, they generate insights and applications you never imagined.
Sustaining measurement over time
One-time snapshots have limited value. Tracking changes over time reveals whether conditions are improving or deteriorating. This requires sustained funding, institutional commitment, and ongoing partnerships.
Build sustainability through:
- Embedding measurement in routine administrative processes
- Securing multi-year funding commitments
- Documenting processes so staff transitions don’t derail work
- Demonstrating value through examples of data-informed decisions
- Cultivating champions across partner organizations
- Automating data pipelines to reduce manual effort
The most resilient measurement systems become institutional infrastructure. They’re not special projects that end when grants expire. They’re core functions that organizations depend on for planning and accountability.
From numbers to healthier communities
Measuring social determinants of health transforms abstract concepts into concrete evidence. It shows exactly where people face barriers to wellbeing and which interventions might help. This clarity cuts through ideology and focuses attention on what actually works.
The frameworks and methods outlined here provide a starting point. Adapt them to your context, resources, and priorities. Start small if needed. A few well-chosen indicators beat a comprehensive system that never launches.
Remember that measurement serves people, not the other way around. The goal isn’t perfect data. It’s healthier, more equitable communities. Let that purpose guide your choices about what to measure, how to analyze, and where to focus intervention efforts. When you connect the dots between social conditions and health outcomes, you create opportunities to address root causes rather than just treating symptoms.
Post Comment