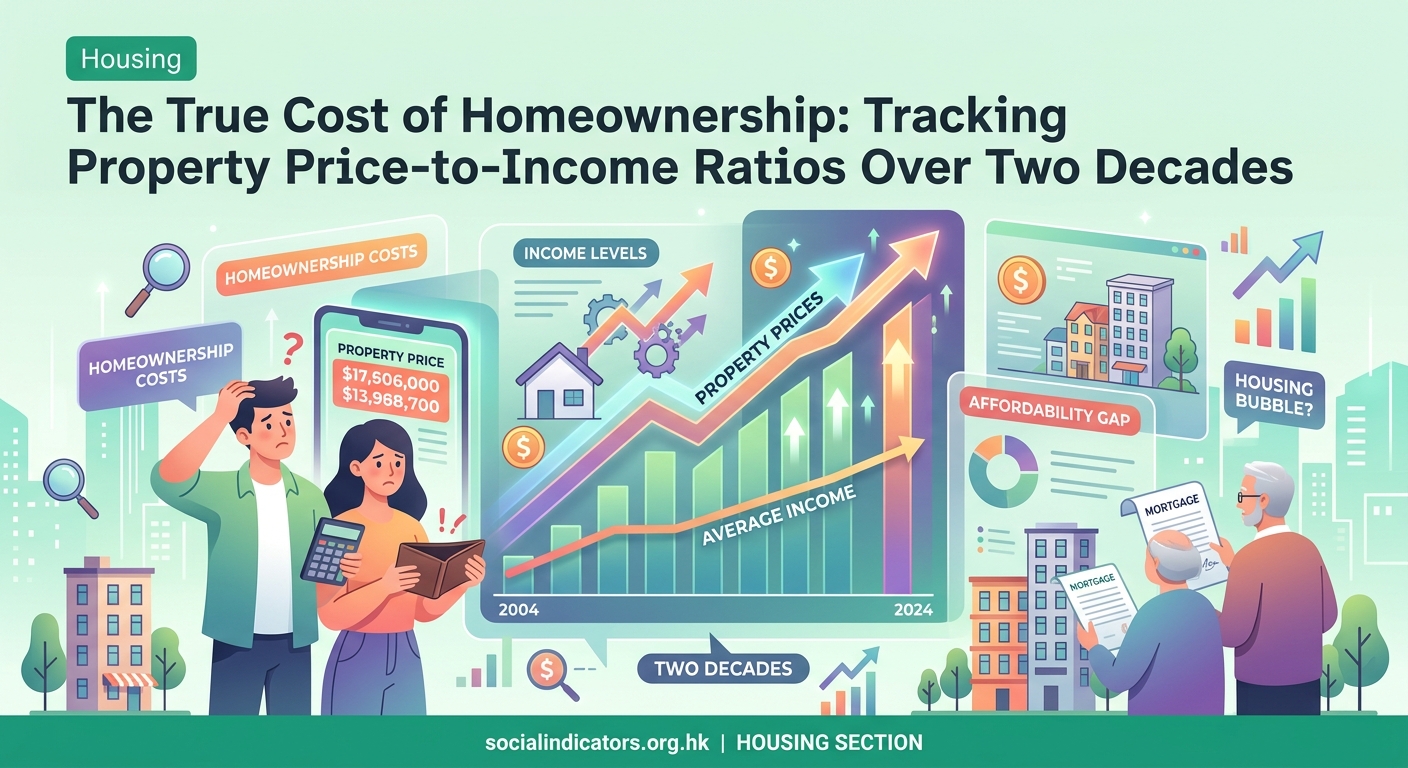
The True Cost of Homeownership: Tracking Property Price-to-Income Ratios Over Two Decades
Housing affordability isn’t just about sticker prices. A property listed at HK$8 million might seem astronomically expensive to someone earning HK$300,000 annually, yet relatively reasonable to a household bringing in HK$1.2 million. The home price to income ratio cuts through the noise by comparing median property values against median household earnings, giving you a clear snapshot of whether homeownership is within reach or slipping further away.
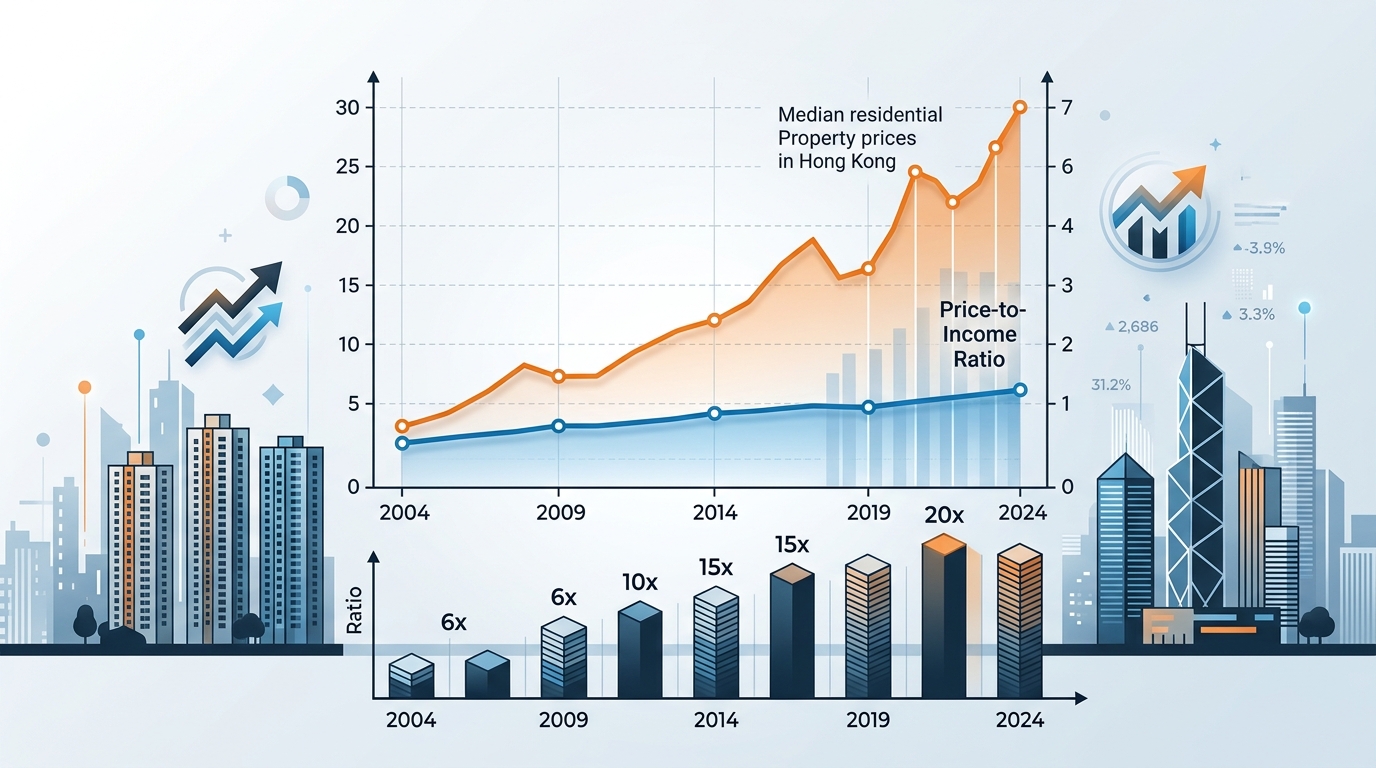
The home price to income ratio divides median property prices by [median household income](https://en.wikipedia.org/wiki/Median_income) to measure [housing affordability](https://en.wikipedia.org/wiki/Housing_affordability). A ratio below 3.0 indicates affordable housing, while anything above 5.0 signals severe affordability challenges. Hong Kong’s ratio has exceeded 20.0 in recent years, making it one of the world’s least affordable markets. Understanding this metric helps buyers time purchases and set realistic expectations.
What the ratio actually measures
The calculation is straightforward. Take the median home sale price in your target area and divide it by the median annual household income.
If median homes sell for HK$6 million and median household income sits at HK$400,000, your ratio is 15.0. That means the typical family would need 15 years of gross income to purchase the median property, assuming they saved every dollar without spending on food, transport, or anything else.
This metric strips away individual circumstances and focuses on the broader market reality. It doesn’t care if you personally earn more or less than the median. It shows whether housing prices have outpaced income growth across the entire population.
Urban planners and economists use a ratio of 3.0 as the threshold for affordable housing. At that level, a household earning HK$500,000 annually could reasonably afford a HK$1.5 million property with standard mortgage terms and manageable debt levels.
Ratios between 3.1 and 4.0 indicate moderately unaffordable conditions. Families can still buy homes, but they’ll stretch their budgets thin.
Once you hit 5.0 and above, you’re looking at seriously unaffordable territory. Homeownership becomes a distant dream for median earners without substantial family help, multiple incomes, or years of aggressive saving.
Hong Kong has consistently recorded ratios above 20.0 since 2016, peaking at 23.2 in 2020. For context, cities like London hover around 13.0, while Sydney sits near 11.0. Even these markets face criticism for poor affordability, yet they pale compared to Hong Kong’s challenges.
How to calculate your personal ratio
The citywide median tells one story. Your personal situation tells another.
-
Identify your target property type and location. Browse recent sales data for similar properties in neighborhoods where you’d actually consider buying.
-
Calculate your annual household income. Include all regular sources: salaries, bonuses, rental income from existing properties, and consistent investment returns. Don’t include one-time windfalls or irregular gifts.
-
Divide the median property price by your total annual household income. This gives you a personalized ratio that reflects your actual purchasing power.
A household earning HK$600,000 targeting HK$4.5 million flats faces a ratio of 7.5. That same household looking at HK$9 million properties faces a ratio of 15.0, dramatically different affordability profiles despite identical income.
Your personal ratio helps you set realistic targets. If you’re comfortable with a 10.0 ratio and earn HK$500,000 annually, you should focus on properties around HK$5 million rather than browsing listings at HK$8 million.
Banks typically approve mortgages when monthly payments don’t exceed 40% to 50% of gross monthly income. A ratio above 10.0 often pushes you past these limits unless you make a substantial down payment.
Reading the market through ratio trends
Static numbers only tell half the story. Tracking how ratios change over time reveals whether conditions are improving or deteriorating.
Hong Kong’s ratio stood at 12.6 in 2003, already high by international standards. It climbed to 17.0 by 2010, then surged past 19.0 by 2015. The trajectory shows housing prices growing far faster than incomes, creating an expanding affordability gap.
When ratios rise, you’re facing headwinds. Properties become more expensive relative to what people earn, suggesting prices may be inflated or incomes are stagnating. Both scenarios hurt prospective buyers.
Falling ratios signal improving conditions. Either property prices are declining, incomes are rising, or both. These periods often present better entry points for first-time buyers.
“A falling ratio doesn’t automatically mean you should buy. You need to understand why it’s dropping. If property prices crash due to economic crisis, falling ratios might coincide with job losses and tighter lending standards. Context matters as much as the number itself.”
The 2008 financial crisis dropped Hong Kong’s ratio from 10.3 in 2007 to 8.8 in 2009, not because affordability improved but because property prices temporarily declined. Buyers who jumped in during that window benefited, but those who lost jobs or faced income cuts couldn’t capitalize.
Compare your local ratio against historical averages. If your market typically hovers around 6.0 but currently sits at 9.0, you’re buying at a relative peak. Waiting might make sense unless you have compelling personal reasons to purchase now.
Common mistakes when using this metric
| Mistake | Why it happens | Better approach |
|---|---|---|
| Comparing different property types | Mixing luxury condos with starter flats skews the data | Segment by property type and size |
| Ignoring location variations | Ratios vary dramatically between districts | Calculate ratios for specific neighborhoods |
| Using gross income without tax adjustments | Overestimates actual purchasing power | Consider after-tax income for realistic assessment |
| Focusing only on median prices | Doesn’t reflect what you can actually afford | Use prices for properties you’d realistically buy |
| Neglecting interest rate environment | Low rates make higher ratios more manageable | Factor in mortgage rates and total cost of borrowing |
The median property price might include everything from studio apartments to luxury penthouses. If you’re a first-time buyer targeting smaller units, using the overall median overestimates your actual ratio.
Similarly, citywide income medians blend high earners in finance with lower earners in service industries. Your professional field and experience level create a personal income profile that might differ significantly from the median.
Some buyers see a ratio of 12.0 and assume homeownership is impossible. They forget that dual-income households, family assistance, or above-median earnings change the equation entirely. The ratio is a starting point for analysis, not a final verdict on your prospects.
What different ratios mean for your strategy
-
Below 3.0: Favorable buying conditions. Properties are affordable relative to incomes. Focus on finding the right property rather than timing the market.
-
3.0 to 5.0: Moderate affordability. You can buy, but budget carefully. Prioritize properties that won’t strain your finances.
-
5.0 to 7.0: Challenging conditions. Consider waiting if possible, or adjust expectations downward on property size and location.
-
7.0 to 10.0: Severely unaffordable. Homeownership requires significant sacrifices, dual incomes, or family support.
-
Above 10.0: Extremely difficult. Median earners are effectively priced out. Focus on income growth, savings accumulation, or alternative housing options.
Hong Kong buyers facing ratios above 20.0 often rely on family help for down payments, accept smaller living spaces than previous generations, or delay homeownership until their 40s rather than their 30s.
International buyers comparing markets use these ratios to identify cities where their income goes further. Someone earning USD 100,000 annually faces vastly different prospects in a market with a 4.0 ratio versus one at 15.0.
Investors watch ratios to gauge rental market dynamics. High ratios often correlate with strong rental demand, as fewer people can afford to buy. Low ratios might signal weak rental yields, as homeownership becomes more accessible.
How policy changes affect the ratio
Government interventions can shift ratios without changing underlying market fundamentals. Hong Kong introduced buyer stamp duties, increased down payment requirements, and implemented mortgage stress tests to cool property prices.
These measures can lower ratios by suppressing prices, but they don’t address the income side of the equation. A ratio that drops from 22.0 to 18.0 due to regulatory cooling measures still indicates severe unaffordability.
Some governments tackle ratios by boosting incomes through minimum wage increases or tax credits for first-time buyers. Others increase housing supply through public housing programs or zoning reforms that allow denser development.
Buyers should monitor policy discussions around housing affordability. Announced measures might signal future ratio changes, helping you time your purchase more strategically.
Interest rate changes also impact effective affordability even when the ratio stays constant. A ratio of 8.0 with 2% mortgage rates creates different monthly payments than the same ratio with 5% rates. The ratio measures price relative to income, but borrowing costs determine actual payment burdens.
Using the ratio alongside other metrics
The home price to income ratio is powerful but incomplete. Combine it with other indicators for a fuller picture.
Rental yields show what percentage of property value you could earn through rent. Low yields in high-ratio markets suggest prices are inflated relative to both incomes and rental income potential.
Months of inventory reveals how many months it would take to sell all listed properties at the current sales pace. High inventory with rising ratios suggests prices may be vulnerable to correction.
Mortgage payment to income ratios calculate monthly housing costs against monthly earnings. This metric accounts for interest rates and loan terms, giving you a more practical affordability measure than the simple price-to-income calculation.
Population growth and employment trends affect future demand. A market with a 6.0 ratio but declining population might see ratios fall further. A market at 8.0 with strong job growth and population inflows might see ratios rise.
Construction permits and housing starts indicate future supply. If ratios are high but new construction is surging, increased supply might eventually ease price pressure and lower ratios.
Making decisions in high-ratio environments
You can’t control citywide ratios, but you can adapt your strategy.
Expand your geographic search. Ratios vary significantly between urban cores and suburbs. You might find acceptable ratios by extending your commute or choosing less prestigious neighborhoods.
Adjust your property expectations. A three-bedroom apartment might be out of reach, but a two-bedroom could work. Older buildings often trade at lower ratios than new developments.
Increase your down payment. A larger initial payment reduces your loan amount, making properties affordable even when ratios are high. Saving an extra year or two might make more financial sense than stretching to buy now.
Consider shared ownership programs if available. Some markets offer schemes where you buy a percentage of a property and rent the remainder, effectively lowering your entry ratio.
Boost your income before buying. A 10% salary increase through job change or promotion improves your personal ratio more than waiting for a 10% price decline, which might never materialize.
Some buyers accept high ratios as the new normal in their markets. They prioritize homeownership despite the financial strain, viewing property as a forced savings mechanism and inflation hedge.
Others reject homeownership at extreme ratios, choosing to rent and invest the difference in diversified portfolios. Neither approach is inherently right. Your decision depends on personal priorities, risk tolerance, and long-term plans.
Putting the numbers to work
The home price to income ratio transforms abstract price tags into concrete affordability assessments. It tells you whether housing markets are functioning reasonably or spiraling into territory where median earners face permanent exclusion.
Calculate your personal ratio before house hunting. Track how local ratios have changed over the past five and ten years. Compare your market against similar cities to understand whether you’re facing unusual conditions or global trends.
Use the ratio as a reality check, not a barrier. High ratios mean you need to be more strategic, not that homeownership is impossible. They signal the need for careful planning, realistic expectations, and possibly creative solutions.
Most importantly, remember that ratios measure markets, not your individual potential. Your income can grow. Your savings can accumulate. Your circumstances can change. The ratio shows you the playing field, but you still decide how to play the game.


Post Comment