
Tracking Two Decades of Social Change Through Hong Kong’s Development Index
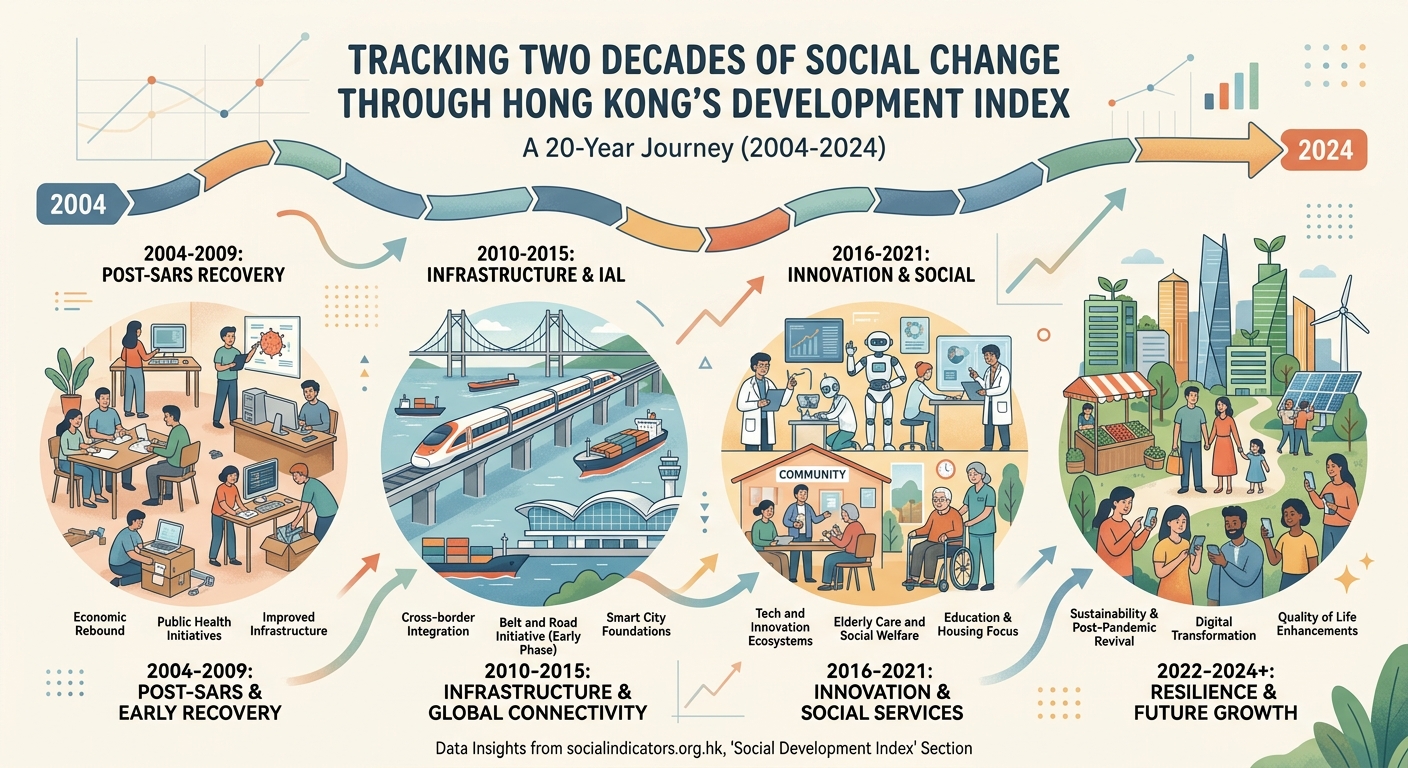
Hong Kong’s transformation over the past two decades tells a story far more complex than GDP figures alone can capture. Behind the gleaming skyscrapers and bustling financial districts lies a detailed measurement system tracking how ordinary residents experience education, healthcare, housing, and economic opportunity. The Hong Kong social development index offers researchers and policymakers a comprehensive lens for understanding these changes.
The Hong Kong social development index measures quality of life across multiple dimensions including economic opportunity, education, health, housing, and social stability. Since its creation, the index has revealed widening inequality gaps and persistent housing challenges despite economic growth. Researchers use this [composite metric](https://en.wikipedia.org/wiki/Composite_indicator) to track long-term trends and inform evidence-based policy recommendations for improving resident wellbeing.
What the index actually measures
The Hong Kong social development index breaks down social progress into measurable components that matter in daily life. Rather than relying on a single economic indicator, this composite approach examines multiple domains simultaneously.
The index tracks five core dimensions. Economic performance looks beyond aggregate wealth to examine income distribution and employment quality. Education indicators measure not just enrollment rates but also educational attainment and access to learning resources. Health metrics assess life expectancy, disease prevalence, and healthcare accessibility. Housing examines affordability, living space, and residential stability. Social stability evaluates crime rates, family structures, and community cohesion.
Each dimension receives equal weighting in the overall calculation. This balanced approach prevents any single factor from dominating the narrative about social progress.
The methodology draws from official government statistics, census data, and household surveys. Researchers standardize these diverse data sources into comparable metrics that can track changes over time. The result is a single composite score that rises when conditions improve and falls when they deteriorate.
Two decades of tracked changes
The index reveals patterns that might escape notice in year-to-year snapshots. Some trends show steady improvement while others have stagnated or reversed.
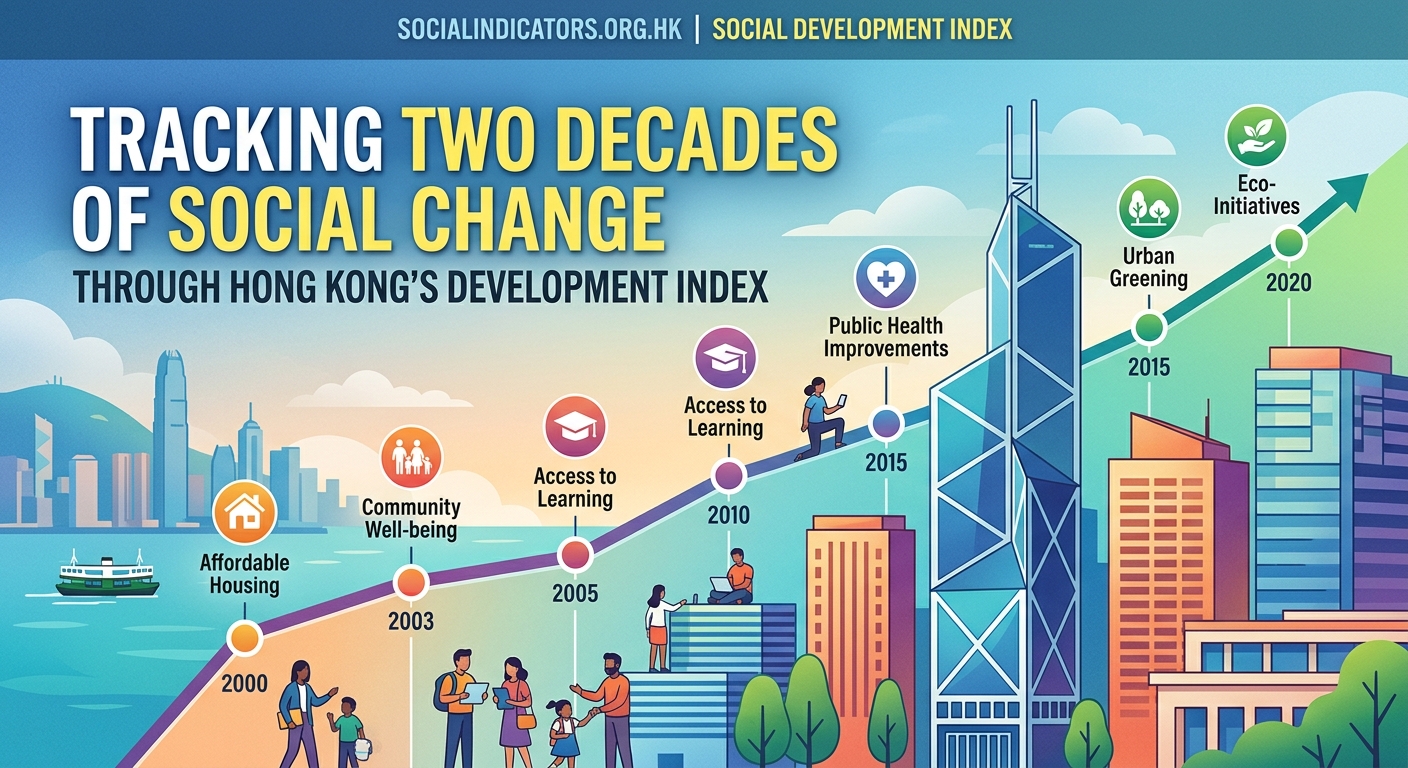
Educational attainment climbed significantly between 2000 and 2020. More residents completed secondary and tertiary education during this period. Access to quality schools expanded across different districts. These gains contributed positively to the overall index score.
Health outcomes also improved over the tracking period. Life expectancy increased for both men and women. Infant mortality rates declined. Public health initiatives reduced the prevalence of certain chronic diseases. These advances reflect both better medical care and improved living conditions.
Housing tells a different story. Affordability declined sharply as property prices outpaced income growth. Average living space per person remained constrained. Waiting times for public housing lengthened. These negative trends pulled down the housing component of the index substantially.
Income inequality widened throughout the measurement period. The gap between high earners and low earners grew larger. Wage growth for middle-income workers stagnated while returns to capital increased. This divergence created social tensions that the index captures through its economic dimension.
The value of composite indices lies in their ability to reveal trade-offs and hidden costs. A society can experience economic growth while simultaneously seeing declines in housing affordability or increases in inequality. Single metrics miss these crucial dynamics.
How researchers apply this data
Academic work using the Hong Kong social development index spans multiple disciplines. Sociologists examine how different demographic groups experience social change. Economists analyze the relationship between economic policies and quality of life outcomes. Urban planners use the data to identify neighborhoods requiring intervention.
Policy analysts compare Hong Kong’s trajectory with other high-income Asian cities. Singapore, Tokyo, and Seoul provide useful benchmarks for understanding whether observed trends are unique or part of broader regional patterns. These comparative studies help distinguish local policy effects from global economic forces.
Graduate students writing theses often use the index as a dependent variable. They test whether specific policy interventions correlate with improvements in particular dimensions. For example, a researcher might examine whether transportation infrastructure investments improved access to employment and education opportunities.
Think tanks cite the index when advocating for policy reforms. When proposing changes to housing policy, they reference the declining affordability scores. When arguing for education funding, they point to areas where the index shows stagnation despite overall economic growth.
The index also serves as a reality check against official narratives. Government reports might emphasize GDP growth while the social development index reveals that many residents experienced declining living standards during the same period. This tension between aggregate prosperity and lived experience drives important public debates.
Reading the numbers correctly
Understanding what the index reveals requires careful interpretation. A rising composite score indicates improvement across multiple dimensions, but it doesn’t mean every resident benefits equally. Averages can mask significant variation within the population.
Geographic disparities matter enormously. Some districts show strong performance across all dimensions while others lag behind. Researchers disaggregate the data by region to identify these spatial patterns. A family living in a well-served area with good schools and accessible healthcare experiences very different conditions than one in a poorly connected neighborhood.
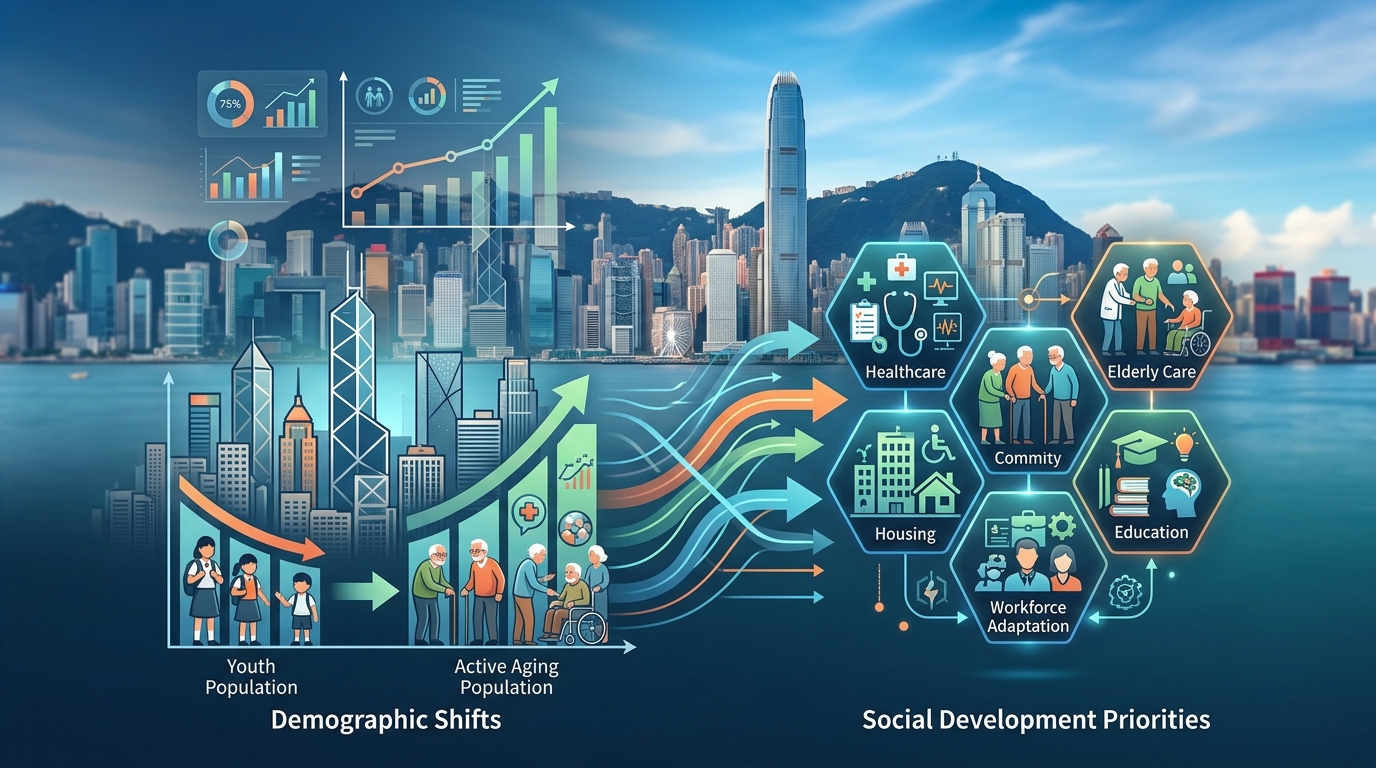
Demographic breakdowns reveal which groups face the greatest challenges. Age cohorts experience social change differently. Young adults entering the housing market face affordability pressures that older homeowners don’t encounter. Elderly residents rely more heavily on healthcare services and experience different mobility constraints.
The index captures correlation but not causation. When multiple dimensions move together, it suggests they’re interconnected, but determining which factors drive which outcomes requires additional analysis. Rising education levels might improve employment prospects, or better economic opportunities might enable families to invest more in education. Both mechanisms could operate simultaneously.
Temporal lags complicate interpretation. Policy changes take years to produce measurable effects. A housing initiative launched in 2015 might not show up in index scores until 2020 or later. Researchers account for these delays when evaluating policy effectiveness.
Common analytical approaches
Researchers employ several standard techniques when working with social development index data. These methods help extract meaningful insights from the numbers.
-
Trend analysis examines how individual dimensions and the composite score change over time. Researchers plot these trajectories to identify inflection points where conditions improved or deteriorated sharply.
-
Comparative analysis benchmarks Hong Kong against similar cities or regions. This approach helps determine whether observed patterns reflect local factors or global trends affecting multiple locations.
-
Decomposition analysis breaks down changes in the composite score to identify which dimensions drove overall movement. If the index declined, was it primarily due to housing challenges, or did multiple factors contribute?
-
Correlation analysis tests relationships between index components and external variables like policy interventions, economic shocks, or demographic shifts.
-
Scenario modeling projects how the index might evolve under different policy assumptions. Researchers simulate the effects of proposed interventions to estimate their potential impact.
| Analytical Method | Primary Use | Key Limitation |
|---|---|---|
| Trend analysis | Tracking long-term changes | Cannot identify causes |
| Comparative analysis | Benchmarking performance | Context differences matter |
| Decomposition analysis | Identifying drivers | Assumes linear relationships |
| Correlation analysis | Testing associations | Correlation isn’t causation |
| Scenario modeling | Forecasting outcomes | Depends on assumption quality |
Data sources and reliability
The index’s credibility depends on the quality of underlying data. Multiple government departments contribute statistics that feed into the calculation. The Census and Statistics Department provides demographic and economic data. The Department of Health supplies health metrics. The Education Bureau contributes educational statistics.
Survey methodologies matter significantly. Response rates, sampling techniques, and question wording all affect data quality. Researchers examine these technical details when assessing index reliability. A change in survey methodology can create apparent trends that don’t reflect actual social changes.
Some dimensions are easier to measure than others. Health outcomes like life expectancy rely on comprehensive vital statistics that Hong Kong maintains reliably. Social cohesion proves harder to quantify. Proxy measures like crime rates and volunteer participation rates provide indirect evidence but don’t capture the full concept.
Missing data creates challenges. Some historical statistics weren’t collected consistently, creating gaps in the time series. Researchers use statistical techniques to estimate missing values, but these estimates introduce uncertainty. Documentation clearly notes which data points are observed versus estimated.
International comparisons face standardization issues. Different jurisdictions define and measure concepts differently. What counts as adequate housing in one place might not match another location’s definition. Researchers carefully document these definitional differences when making cross-border comparisons.
Practical applications for students
Sociology students find the Hong Kong social development index particularly valuable for several reasons. It provides a concrete example of how abstract concepts like social progress get operationalized into measurable indicators. Understanding this process helps students think critically about measurement challenges in social research.
Class assignments often ask students to critique the index’s construction. Which dimensions does it include or exclude? Are the weightings appropriate? Could alternative measurement approaches reveal different patterns? These exercises develop analytical skills applicable to many research contexts.
The index offers rich material for quantitative methods courses. Students practice data visualization techniques by creating charts showing temporal trends. They calculate descriptive statistics for different dimensions. They run regression analyses testing relationships between index components and other variables.
Research papers benefit from having a well-established dependent variable. Instead of constructing their own quality of life measure, students can use the existing index and focus their effort on analyzing its determinants or consequences. This approach makes ambitious projects feasible within semester time constraints.
The index also illustrates how academic research informs public discourse. Students see their analytical work connecting to real policy debates affecting millions of residents. This connection between scholarly analysis and practical impact motivates engagement with technical material that might otherwise feel abstract.
Critical perspectives and limitations
No measurement system perfectly captures social reality. The Hong Kong social development index has strengths but also notable limitations that researchers acknowledge.
The equal weighting across dimensions reflects a value judgment. Should housing receive the same weight as health or education? Different stakeholders might prioritize these domains differently. A young professional might weight employment opportunities heavily while a retiree focuses more on healthcare access.
The index aggregates diverse experiences into a single number. This simplification enables tracking overall trends but obscures variation within the population. Two people with very different life circumstances might contribute to the same average score.
Some important aspects of social wellbeing don’t appear in the index. Environmental quality, cultural vitality, and political participation all affect quality of life but aren’t captured in the current framework. Expanding the index to include these dimensions would provide a more complete picture but would also complicate the measurement process.
The index focuses on outcomes rather than opportunities. It measures educational attainment but not whether the education system provides equal opportunities to students from different backgrounds. It tracks health outcomes but not whether healthcare access is distributed equitably.
Temporal comparisons assume measurement consistency. If data collection methods change over time, apparent trends might reflect methodological shifts rather than actual social changes. Researchers carefully document any methodological changes to help users interpret trends correctly.
Making sense of recent patterns
Recent years have shown diverging trends across different index dimensions. Understanding these patterns requires looking at the specific forces shaping each domain.
Housing affordability continued its downward trajectory through 2019. Property prices reached levels that made homeownership unattainable for many middle-income families. Public housing waiting times stretched to years. These pressures created significant stress for residents and pulled down the overall index score.
The pandemic introduced sharp disruptions starting in 2020. Health metrics initially deteriorated as COVID-19 spread. Economic indicators weakened as businesses closed and unemployment rose. Education faced challenges as schools shifted to remote learning. These shocks affected all dimensions simultaneously.
Recovery patterns varied across domains. Some economic indicators bounced back relatively fast. Health outcomes stabilized as vaccination rates increased. Education gradually returned to normal operations. Housing challenges persisted regardless of pandemic conditions.
Social stability indicators showed concerning trends. Emigration increased as residents sought opportunities elsewhere. Community cohesion faced strains from various social tensions. These patterns suggest deeper structural issues beyond short-term economic cycles.
Looking forward, the index will continue tracking how these various forces play out. Will housing affordability improve if construction accelerates? Can education adapt to new technologies and changing labor market demands? Will healthcare systems handle aging population pressures? The index provides a framework for monitoring progress on these critical questions.
Strengthening your research with this tool
Policy analysts and academic researchers both benefit from incorporating the Hong Kong social development index into their work. The key is using it appropriately given its strengths and limitations.
Start by clearly defining your research question. Are you trying to explain what drives social progress? Are you evaluating a specific policy intervention? Are you comparing Hong Kong’s trajectory with other cities? Your research question determines how you should use the index.
- Examine individual dimensions rather than just the composite score when your research focuses on specific policy domains
- Use the index as one indicator among several rather than relying on it exclusively
- Account for temporal lags between policy changes and measurable outcomes
- Disaggregate data by geography and demographics when possible to identify disparities
- Document any methodological changes that might affect temporal comparisons
- Consider both statistical significance and practical significance when interpreting results
Combine quantitative analysis of index data with qualitative research methods. Interviews with residents provide context that numbers alone cannot convey. Case studies of specific neighborhoods or demographic groups add depth to statistical patterns. Mixed methods approaches produce richer insights than either approach alone.
Be transparent about limitations in your analysis. Acknowledge what the index can and cannot tell you. Discuss how measurement choices might affect your conclusions. This transparency strengthens rather than weakens your work by demonstrating methodological sophistication.
Building on two decades of measurement
The Hong Kong social development index represents a sustained commitment to evidence-based understanding of social change. Twenty years of consistent measurement creates a valuable resource for researchers studying long-term trends and policy impacts.
Future enhancements could expand the index’s scope. Adding environmental sustainability indicators would capture another crucial dimension of quality of life. Incorporating measures of political participation and civil liberties would provide a fuller picture of social conditions. Developing more granular geographic breakdowns would help identify neighborhood-level disparities.
Methodological refinements continue improving data quality. Better survey techniques reduce non-response bias. Improved statistical methods handle missing data more effectively. Enhanced data visualization makes patterns more accessible to non-specialist audiences.
The index’s greatest value lies in its consistency. The same basic framework applied year after year enables genuine temporal comparison. Researchers can confidently attribute changes to actual social conditions rather than methodological artifacts. This consistency makes the index an increasingly powerful tool as the time series lengthens.
Academic work using this data contributes to public understanding of social progress. When researchers publish findings showing widening inequality or persistent housing challenges, these insights enter policy debates. Evidence-based advocacy becomes possible when reliable data documents problems and tracks whether interventions work.
For students beginning to work with social indicators, the Hong Kong social development index offers an accessible entry point. The methodology is well-documented. The data is publicly available. The policy relevance is clear. These features make it an excellent teaching tool and research resource.
The index reminds us that social progress requires attention to multiple dimensions simultaneously. Economic growth alone doesn’t guarantee improved quality of life if housing becomes unaffordable or inequality widens. Comprehensive measurement helps societies track whether prosperity translates into broadly shared wellbeing. That insight matters everywhere, not just in Hong Kong.

Post Comment