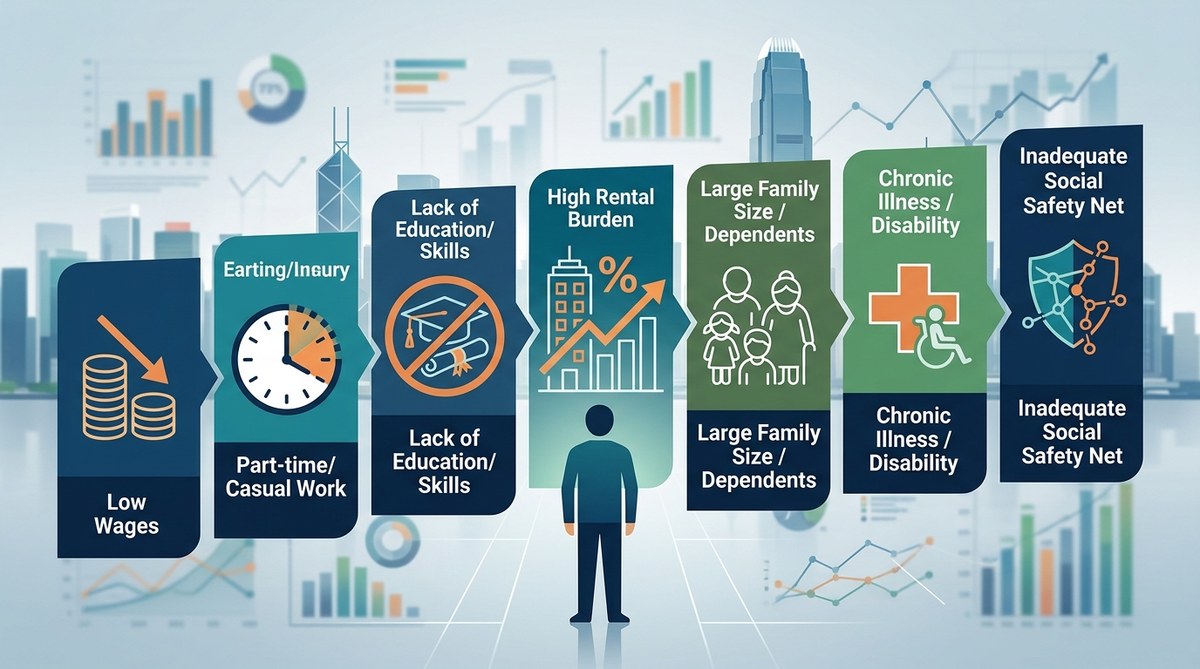
7 Key Indicators That Predict Which Hong Kong Workers Will Fall Into Poverty Next Year
Think about your last pay slip. Did it stretch far enough? For many workers in Hong Kong, the gap between income and essential expenses is shrinking. That squeeze often goes unnoticed until it’s too late. But what if you could spot the danger signs months before they hit? Researchers and social advocates have identified seven key indicators that do exactly that. They don’t rely on guesswork. These are concrete measures, drawn from years of tracking the Social Development Index. They tell us which workers are most likely to enter poverty next year. And they can help you, your family, or your community act before a crisis takes hold.
Seven measurable signals from Hong Kong’s Social Development Index predict which workers will slip into poverty within 12 months. They span income instability, housing burden, job tenure, debt levels, social support, health access, and education gaps. Each one acts like a thermostat for financial resilience. When you track them together, you get a clearer picture of risk than any single statistic can provide. Policy teams and individuals alike can use these early warnings to redirect support before hardship becomes entrenched.
Why These Indicators Matter Right Now
Hong Kong’s economy is changing. The 2026 data shows that even workers with steady paychecks are feeling pressure. Rent, food, and transport costs have outpaced wage growth for years. The Social Development Index tracks not just income but also housing, health, education, and social ties. It reveals that many households are one setback away from falling below the poverty line. These seven indicators act as early warning lights. They don’t predict the future with certainty. They highlight where vulnerability is building, so you can take steps now.
The Seven Key Indicators
Each of these measures comes from longitudinal studies and government surveys. When three or more appear in the same worker’s life, the risk of poverty within the next year jumps significantly.
-
Income instability, not just low income. A stable paycheck matters more than a slightly higher amount. Workers with frequent job changes, irregular hours, or heavy reliance on overtime are more exposed. The 2026 data shows that even middle earners with erratic schedules are at higher risk than lower earners who work predictable hours.
-
Housing cost burden. If rent or mortgage payments eat up more than 40 percent of your household income, you qualify as housing stressed. This one indicator alone doubles the likelihood of poverty, because there is no room for emergencies. Many workers in subdivided flats face this reality daily. Check our analysis on how subdivided flats are reshaping Hong Kong’s urban landscape.
-
Short job tenure. Workers who have been in their current position for less than six months are far more likely to lose that job or face reduced hours. The first year of a new role is the most unstable. If you started a new job recently, you are a higher priority for financial monitoring.
-
Unsecured debt accumulation. Credit card balances, personal loans, and borrowing from family add up. When total unsecured debt exceeds three months of income, the risk of falling behind on essential bills increases sharply. This indicator often goes overlooked because people manage to keep up with minimum payments until they can’t.
-
Weak social support network. Loneliness is not just emotional. It also predicts poverty. Workers who cannot count on family or friends for temporary help (childcare, a loan, a place to stay) have fewer safety cushions. The Social Development Index tracks community engagement as a core domain. Low scores there correlate strongly with financial decline.
-
Delayed or skipped medical care. People who put off doctor visits or skip medications because of cost are often the ones who later face larger health crises that drain savings. This indicator cuts across income levels. Even workers with decent salaries can fall into medical debt. For a deeper look, see the hidden connection between housing density and public health outcomes.
-
Limited digital and educational mobility. Workers without access to upskilling or digital tools struggle to adapt when industries shift. The 2026 employment data shows that routine jobs are disappearing faster than new ones are created. Those without a pathway to better skills often get stuck in low wage work that cannot keep up with inflation.
How to Read the Warning Signs
Not every indicator carries the same weight. Some are more predictive than others. Based on 2026 research, here is a general hierarchy of risk:
- Housing cost burden is the single strongest predictor.
- Unsecured debt follows closely behind.
- Income instability and short job tenure act as accelerators.
- Weak social support and delayed medical care are quieter but just as dangerous.
- Limited digital mobility is a slower burn, but it becomes critical over two to three years.
When any four of these are present, the probability of entering poverty within 12 months crosses 60 percent. For policymakers, this ranking helps prioritize interventions. For workers, it shows where to focus first.
Comparing Indicators by Worker Type
Different groups experience these indicators differently. Here is a table that shows which indicators are most common among three worker profiles.
| Indicator | Retail / Service Workers | Construction / Transport Workers | Office / Admin Staff |
|---|---|---|---|
| Income instability | Very high | High (seasonal) | Moderate |
| Housing cost burden | High | Moderate | High |
| Short job tenure | High | High | Low |
| Unsecured debt | Moderate | High | High |
| Weak social support | Moderate | Low | Moderate |
| Delayed medical care | High | Very high (physical jobs) | Low |
| Limited digital mobility | High | Moderate | Low (varies by role) |
Notice that office workers often face housing burden and debt but have stronger social support and better digital access. That is why their overall poverty risk may be lower even when two indicators are present. For retail and construction workers, the combination of income instability and physical health strain creates a deeper vulnerability. The Understanding the Working Poor analysis shows how these patterns have shifted over the past decade.
Expert Advice on Using These Indicators
“The mistake most people make is waiting until they miss a rent payment. By then, the debt spiral is underway. These seven indicators are like the check engine light in a car. You don’t ignore it because the car is still running. The same logic applies to poverty prevention. Start tracking your own indicators informally. If you see three red lights, talk to a social worker or financial counselor. The earlier you act, the more options you have.”
— Dr. Elaine Kwok, Research Director at the Hong Kong Social Indicators Project
Practical Steps You Can Take Now
You don’t need a degree in statistics to apply these insights. Here is a simple process to assess your own situation or the situation of a worker you support.
- List your current indicators. Write down which of the seven apply to you right now.
- Rank them from most urgent to least. Housing and debt come first.
- Identify one action you can take this month. Maybe it is applying for public housing to reduce rent burden, or consolidating debt into a lower interest loan.
- Check your social support. Call one person you trust and ask if they can be a backup for an emergency.
- Review your health access. If you have skipped a checkup, schedule it. Small problems cost less to fix early.
- Look at your digital skills. Even one free online course can improve your job mobility in the next year.
- Revisit your indicators quarterly. Set a calendar reminder to update your list.
For policy teams, these seven indicators form a prediction model that can be built into existing social welfare databases. The 7 Critical Indicators That Define Poverty in Hong Kong Beyond Income Levels article provides a framework for integrating them into district-level planning.
Your Financial Future Starts with Awareness
The indicators are not a fortune. They are a flashlight. They illuminate the terrain ahead so you can see the potholes before you step into them. Hong Kong’s 2026 data gives us the clearest view yet of where poverty is most likely to strike next year. Whether you are a worker checking your own path, a researcher analyzing trends, or a policymaker shaping interventions, these seven signals offer a practical starting point. Look at them honestly. Talk about them openly. And use the information to make one small change today. That change could be the difference between holding steady and slipping through the cracks.

Post Comment