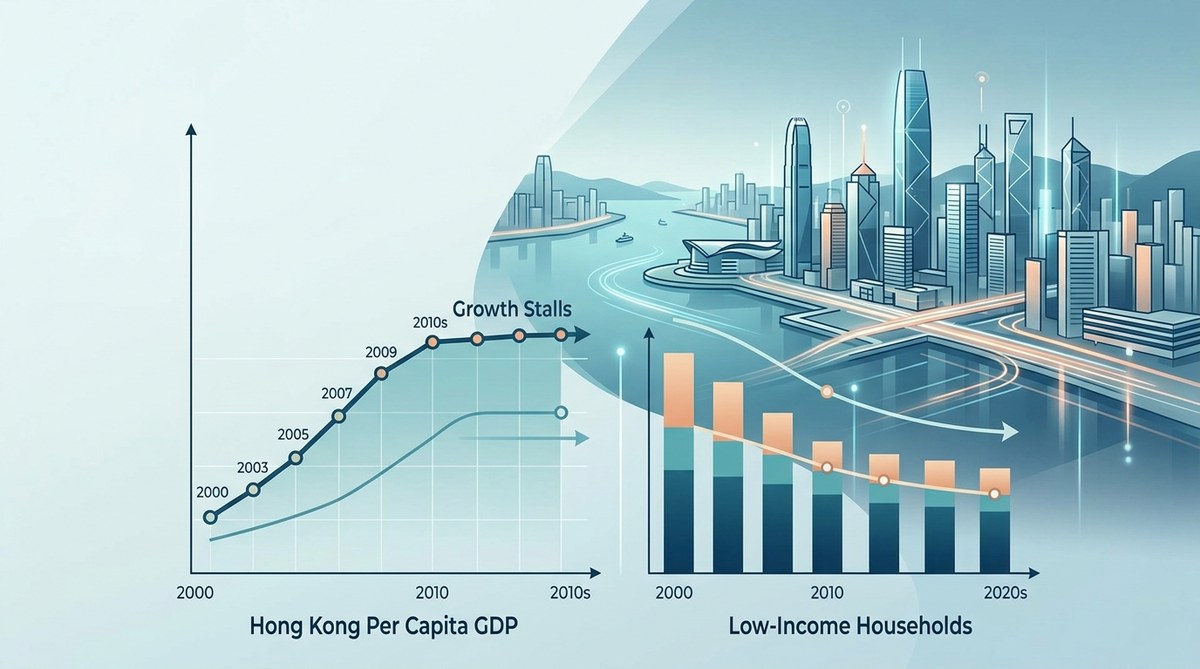
When Economic Growth Stalls: Tracking Hong Kong’s Per Capita GDP Stagnation and Its Impact on Low-Income Households Since 2000
For more than two decades, Hong Kong’s economy has been running a marathon that feels more like a slow crawl. The city’s gross domestic product (GDP) per capita, once a shining star of Asian growth, has been stuck in a pattern of sluggishness since the early 2000s. While the headline numbers might show a slight upward trend, the reality for ordinary families, especially those on lower incomes, tells a different story. When the economic pie stops growing at a healthy rate, the slices for those at the bottom get thinner. This is not just a statistic. It is a lived experience for hundreds of thousands of households.
Hong Kong’s per capita GDP stagnation since the early 2000s has not affected all residents equally. Low-income households have absorbed the heaviest blow through stagnant wages, rising housing costs, and reduced social mobility. Tracking this data is essential for designing policies that protect vulnerable communities and promote inclusive growth.
What Does Per Capita GDP Stagnation Actually Mean?
Per capita GDP is a simple measure: the total value of goods and services produced in Hong Kong, divided by its population. When this number stalls, it means the average economic output per person is not growing. For a city that once posted annual growth rates of 5% to 7%, the drop to rates hovering around 1% to 2% (or even negative in some years) is a major shift.
But averages hide a lot. A rising tide lifts all boats, but a stagnant tide leaves some boats stranded. Since 2000, Hong Kong’s economy has faced multiple shocks: the Asian financial crisis, the SARS outbreak, the global financial crisis of 2008, political unrest, and the pandemic. Each event has left a scar on the growth trajectory. The key issue is that the recovery periods have become weaker and shorter.
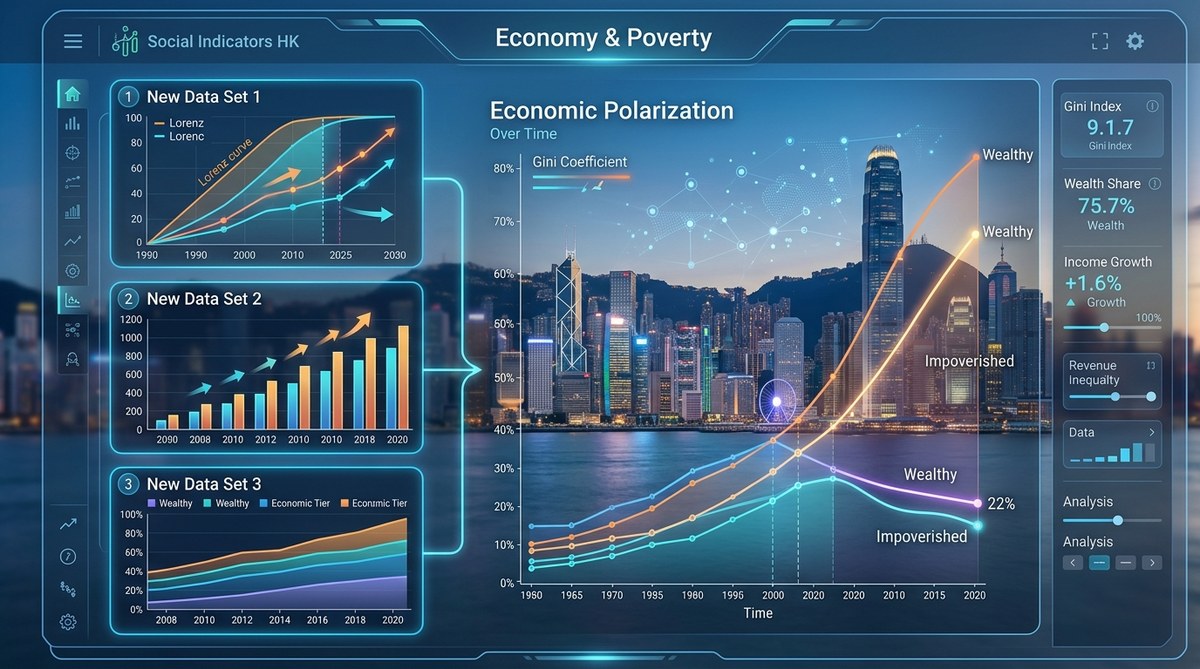
For a policy analyst or socially conscious investor, the question is not just “how much did the economy grow?” but “who captured that growth?” The data shows that a disproportionate share of whatever growth occurred went to the top income brackets. This is where the Social Development Index becomes a critical tool. It tracks not just money, but health, education, housing, and social participation. When GDP per capita stagnates, these other indicators often suffer first for low-income groups.
The Direct Impact on Low-Income Households
Stagnation does not mean standing still. For low-income households, it often means falling backward. Here is how the slowdown has hit home.
Stagnant Wages vs. Rising Costs
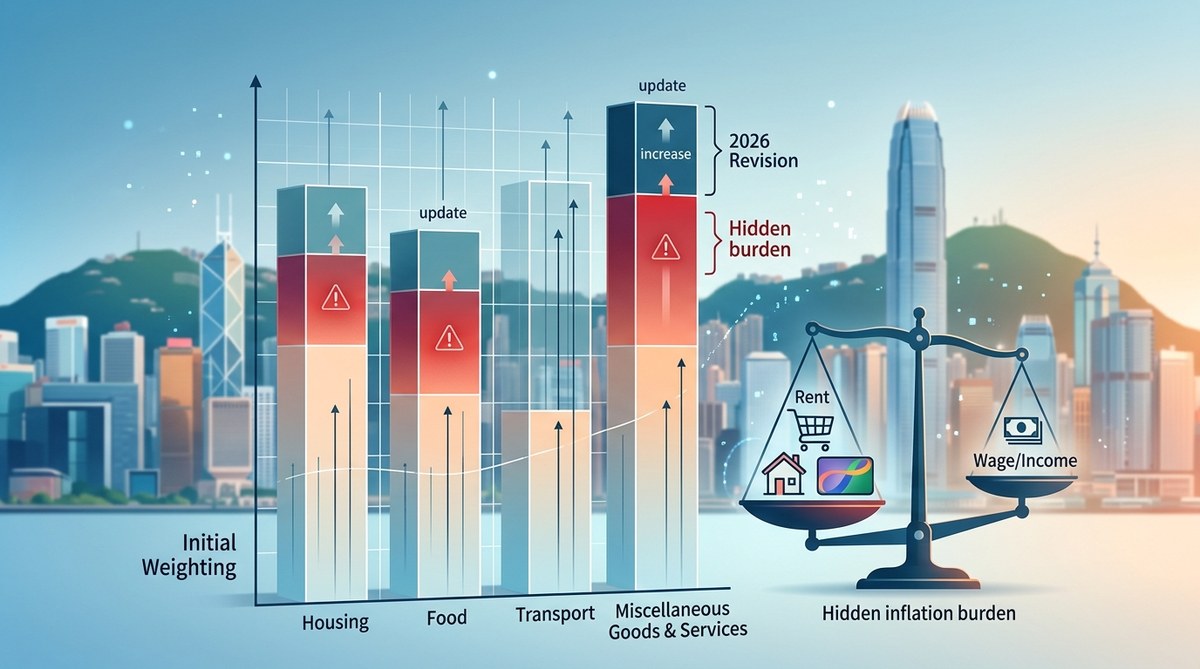
Wages for lower-skilled workers in Hong Kong have barely budged in real terms since the mid-2000s. Meanwhile, the cost of essentials has climbed steadily. Rent, food, transportation, and utilities all eat up a larger share of a shrinking pie.
A 2025 study by the Hong Kong Council of Social Service found that the cost of living for a low-income family of four had increased by over 30% since 2015, while their median income grew by less than 8%. This gap is a direct consequence of per capita GDP stagnation. When the economy does not generate enough new value, employers have less room to raise wages, and landlords have less incentive to lower rents.
Housing Stress Intensifies
Hong Kong’s housing crisis is well documented. But per capita GDP stagnation makes it worse. A stagnant economy means fewer new housing units are built, and the existing stock becomes more expensive relative to income. For low-income renters, this is a disaster.
The percentage of household income spent on rent for the bottom 20% of earners has climbed from around 30% in 2000 to over 50% in 2026. That leaves very little for everything else. Families are pushed into smaller, lower quality housing, often in subdivided flats or remote areas. This is not just a housing issue. It is a health issue, an education issue, and a social mobility issue all rolled into one.
Reduced Social Safety Nets
When the economy grows slowly, government tax revenues also grow slowly. This limits the ability to expand social welfare programs. Hong Kong’s social spending as a percentage of GDP has remained relatively flat for two decades, despite rising needs.
Programs like the Comprehensive Social Security Assistance (CSSA) and housing subsidies have not kept pace with inflation or the rising cost of living. For a single parent or an elderly person on a fixed income, the support they receive today buys much less than it did ten years ago. This is a hidden consequence of stagnation that the Social Development Index captures well.
How to Track the Impact Using the Social Development Index
The Social Development Index (SDI) is a composite measure that goes beyond GDP. It includes domains like civic participation, cultural engagement, and personal safety. For researchers and policy advocates, it is a better tool for understanding the real-world effects of economic stagnation.
Here is a practical process for using the SDI to monitor the situation:
- Identify the relevant domains. Focus on income, housing, health, and education. These are the areas most sensitive to per capita GDP changes.
- Compare trends over time. Look at the SDI sub-indices for low-income groups specifically. See how they have changed relative to the overall index.
- Cross-reference with GDP data. Plot the per capita GDP growth rate against the SDI scores for low-income households. A growing divergence signals that the benefits of growth (or the costs of stagnation) are not shared equally.
- Use district-level data. Hong Kong’s inequalities are spatial. Some districts have fared much better than others. The SDI can help pinpoint where the most vulnerable populations live.
- Share your findings. Use the data to inform policy recommendations. The goal is to move from awareness to action.
Key Data Points to Watch in 2026
For anyone tracking this issue, here are the critical indicators to monitor this year:
- Real wage growth for the bottom decile: Is it keeping up with inflation?
- Rent-to-income ratio for low-income renters: Is it stabilizing or climbing further?
- Poverty rate after housing costs: This is a more accurate measure of disposable income.
- Social welfare spending as a share of GDP: Is the government increasing its investment?
- Social Development Index score for the “Living Standard” domain: This is the most direct measure of material well-being.
Common Misconceptions About Stagnation and Poverty
There are several myths that often cloud the discussion. Let’s clear them up.
| Misconception | Reality |
|---|---|
| Stagnation only affects the poor. | It affects everyone, but the poor have fewer buffers. |
| A small GDP growth is still growth. | If growth is below population growth plus inflation, per capita real income falls. |
| Hong Kong’s economy is too rich to feel the pain. | Inequality means the pain is concentrated. The wealthy are largely insulated. |
| The government can just spend its way out. | Stagnation limits revenue. Spending without growth leads to deficits or debt. |
| The Social Development Index is too abstract. | It is a composite of real, measurable indicators like school enrollment and hospital wait times. |
“Per capita GDP stagnation is like a slow leak in a tire. You might not notice it at first, but over time, the car sits lower and lower. For the families already in the back seat, the ride gets a lot bumpier.” – Dr. Lina Chan, Research Fellow at the Hong Kong Institute of Social Development
Why Traditional Economic Indicators Miss the Full Picture
GDP per capita is a blunt instrument. It tells you the size of the economy, but not how that size is distributed. It does not capture unpaid care work, the value of a clean environment, or the cost of social isolation. For low-income households, these non-market factors are often more important than the cash income they earn.
The Social Development Index fills this gap. It includes measures like:
- Access to public services: Can a low-income family get a doctor’s appointment or a school place?
- Social support networks: Do people have friends or family they can rely on?
- Personal safety: Do people feel safe in their neighborhoods?
- Civic participation: Can people voice their concerns and influence decisions?
When per capita GDP stagnates, these softer indicators often decline first. A family might still have a job, but if they cannot afford childcare or feel unsafe on the street, their quality of life is eroding. This is the hidden cost of stagnation.
Connecting the Data to Real Lives
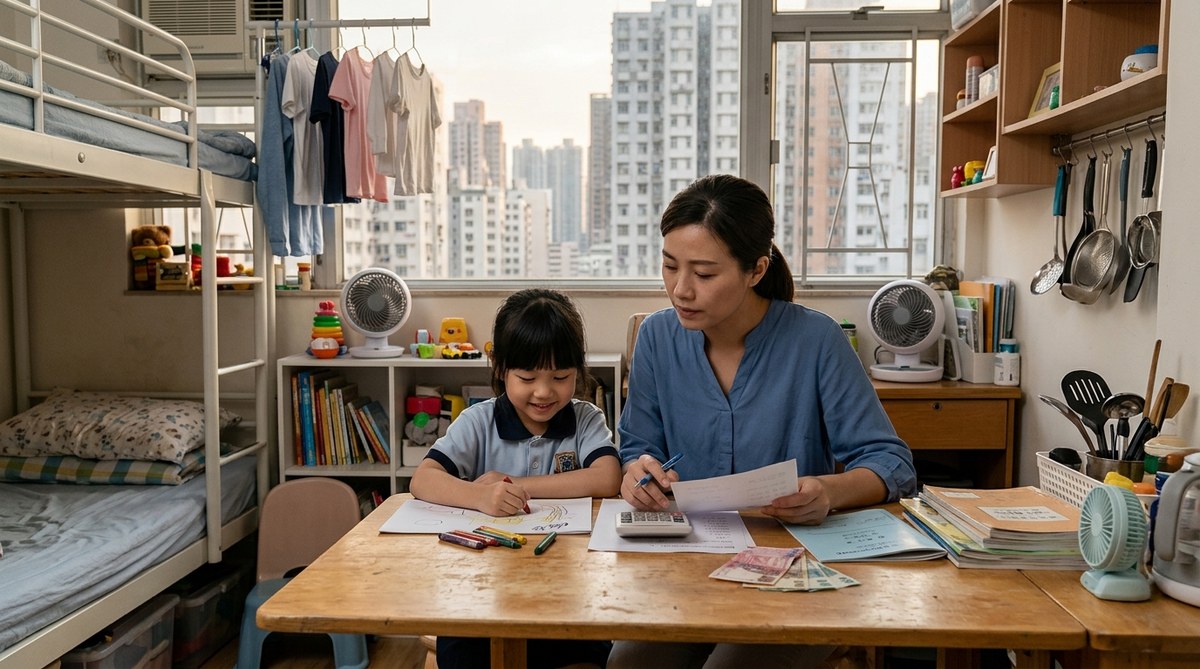
Consider a family living in a subdivided flat in Sham Shui Po. The father works as a security guard. The mother works part-time at a restaurant. They have two school-aged children. In 2000, their combined income might have covered rent, food, and school supplies with a little left over. By 2026, the same jobs pay only slightly more in nominal terms, but rent has doubled and food costs are up by 60%.
This family is not captured in the GDP numbers. They are not unemployed. They are not homeless. But they are under immense stress. The children might have to share a desk. The parents might skip meals to afford the bills. This is the texture of stagnation that the Social Development Index is designed to reveal.
For more on how these pressures manifest, you can read about how income inequality in Hong Kong has evolved over three decades. The data shows a clear pattern of divergence that mirrors the GDP slowdown.
The Role of Policy in Breaking the Cycle
Stagnation is not destiny. Policy choices matter. Other cities and countries have faced similar slowdowns and managed to protect their most vulnerable citizens. The key is to shift from a focus on aggregate growth to a focus on inclusive growth.
Some policy options that could help include:
- Progressive taxation: Raising more revenue from high-income earners and corporations to fund social programs.
- Rent control and housing subsidies: Directly reducing the housing cost burden for low-income families.
- Investment in public goods: Better healthcare, education, and transportation that benefit everyone, but especially the poor.
- Minimum wage increases tied to productivity: Ensuring that the lowest paid workers share in any economic gains.
Without these interventions, the gap between the haves and have-nots will continue to widen. The Social Development Index provides the evidence base to argue for these changes. It turns anecdotal stories into systematic data.
For a deeper look at how employment patterns affect poverty, see our analysis on understanding the working poor: employment statistics that challenge common assumptions. The data challenges the idea that a job is always a ticket out of poverty.
What 20 Years of Data Reveals About Resilience
Despite the stagnation, Hong Kong has shown remarkable resilience. The economy has not collapsed. Unemployment, while higher than in the past, is still low by global standards. But resilience is not the same as thriving. The city is treading water, and for the lowest income households, the water is getting deeper.
The 20 years of GDP data shows a clear pattern: each successive crisis has a longer tail. The recovery from the 2008 financial crisis was slower than the recovery from SARS. The recovery from the pandemic has been slower still. This is a worrying trend. It suggests that the underlying structural problems are getting worse, not better.
For investors, this means that the old assumptions about Hong Kong as a guaranteed growth market no longer hold. Socially conscious investors need to look beyond the headline GDP numbers and consider the social and political risks that come with rising inequality.
A Call for Better Data and Better Action
The first step to solving a problem is measuring it. The Social Development Index is a powerful tool, but it needs to be used more widely. Researchers, policy analysts, and advocates should push for:
- More frequent updates to the SDI.
- Disaggregated data by income, district, and demographic group.
- Integration of the SDI into government policy planning.
- Public awareness campaigns to make the data accessible.
When the data is in the open, the conversation shifts. It becomes harder to ignore the fact that low-income households are bearing the brunt of a slow-growth economy. It becomes easier to demand accountability and action.
To understand how these trends compare globally, take a look at how Hong Kong’s social development metrics compare against global standards. The comparison highlights both strengths and areas for urgent improvement.
Putting the Pieces Together for a Fairer Future
Hong Kong’s per capita GDP stagnation is not a temporary blip. It is a structural condition that has persisted for over two decades. Its effects are not uniform. Low-income households have been hit hardest, through stagnant wages, rising housing costs, and a fraying social safety net.
The Social Development Index offers a way to see this reality clearly. It moves the conversation beyond GDP and into the lived experience of real people. For anyone who cares about social justice, economic resilience, or the future of this city, tracking these indicators is not just an academic exercise. It is a moral imperative.
The data is clear. The path forward requires honest recognition of the problem and bold policy action. By using the tools available, we can build a Hong Kong where growth serves everyone, not just the few at the top.

Post Comment