Special Educational Needs Support: Tracking Resource Allocation and Student Outcomes Over Time
Managing budgets for special education programs means keeping track of dozens of moving parts at once. You need to know where every dollar goes, which students receive what services, and whether those services actually help kids succeed.
Most districts struggle with this. Spreadsheets multiply. Data sits in different systems. When someone asks about spending trends or student progress, you scramble to pull reports from three different platforms.
Better tracking methods exist. They help you see patterns, spot inefficiencies, and prove that your programs work.
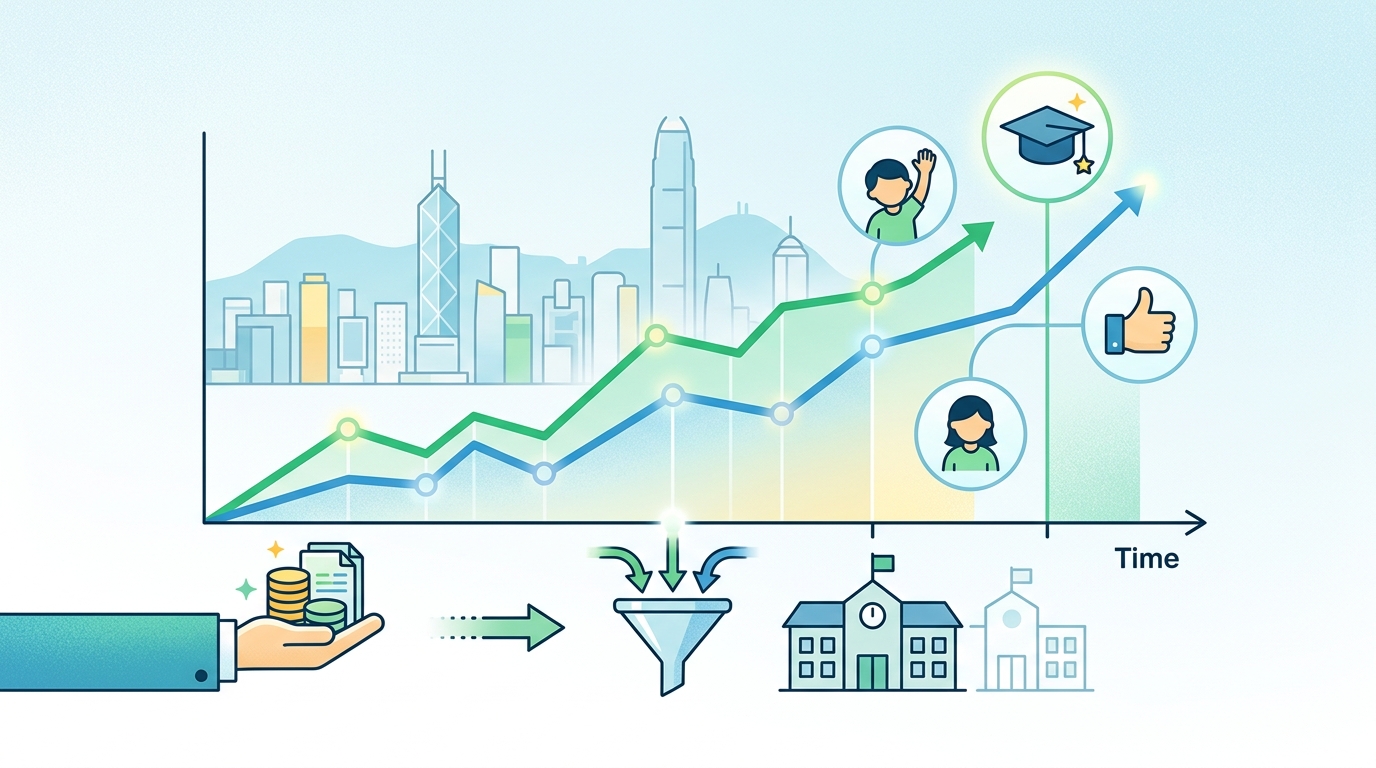
Special education resource allocation tracking combines budget monitoring, service delivery records, and student outcome data into unified systems. Effective tracking reveals spending patterns, identifies resource gaps, and demonstrates program impact. Administrators who implement structured tracking methods make faster decisions, justify budget requests with evidence, and ensure equitable distribution of services across all students who need support.
Why traditional tracking methods fall short
Paper forms and disconnected spreadsheets create gaps. A teacher logs therapy sessions in one document. The finance team tracks invoices in another. Student progress notes live in a third system.
Nobody sees the complete picture. You cannot answer basic questions without days of manual work. How much did we spend on speech therapy last quarter? Which schools have the highest per-student costs? Are students making progress that justifies current spending levels?
These gaps waste time and money. Worse, they hide problems until they become crises. A school runs out of aide hours in March. Another school has surplus budget but no process to reallocate it. Students wait months for evaluations because nobody tracked the backlog.
Modern tracking systems connect these dots. They link financial data to service records and student outcomes in real time.
Building your tracking foundation
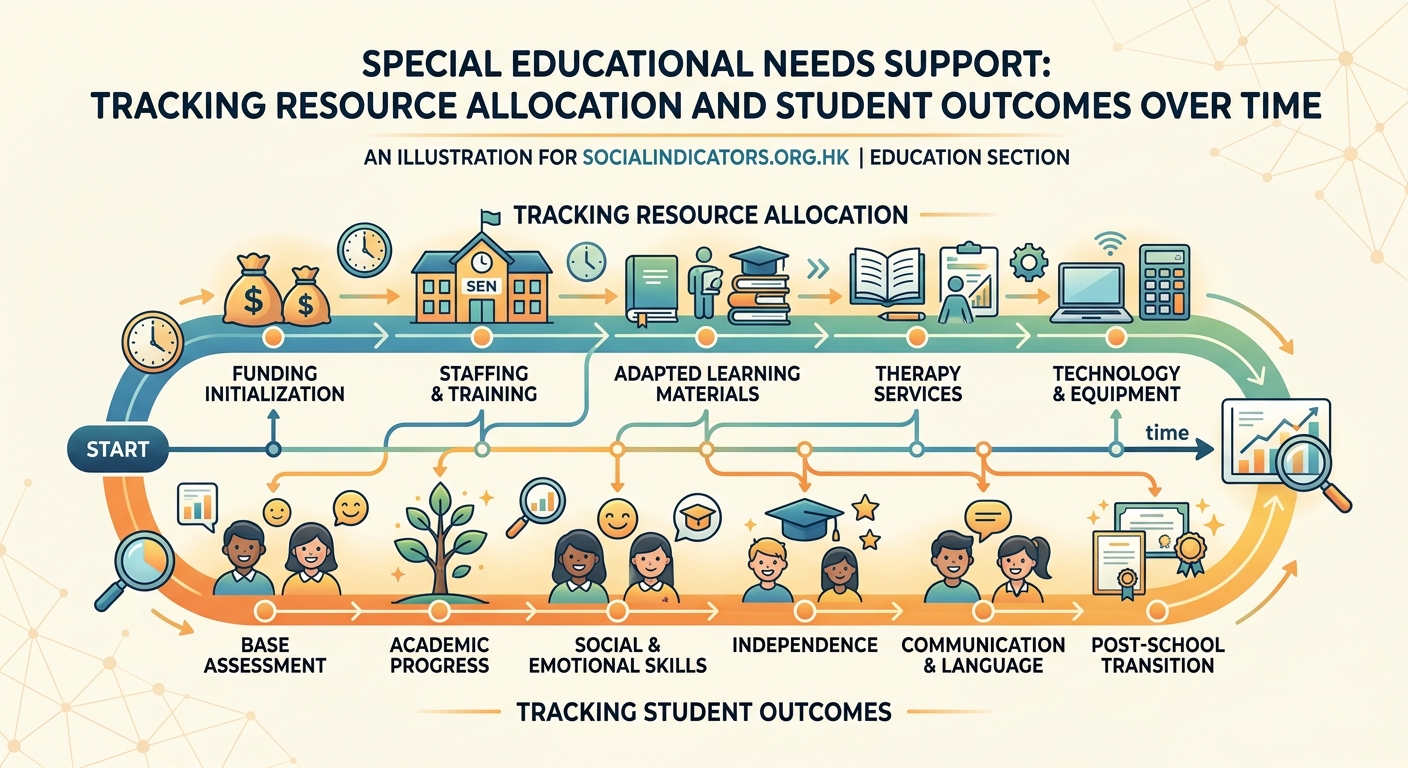
Start with three core data streams. Each one tells part of the story. Together, they show you everything.
Budget and expenditure data includes all spending on special education services. Personnel costs, contracted services, materials, equipment, transportation, and professional development all belong here. Track actual spending against budgets at multiple levels: district-wide, by school, by program type, and by individual student when relevant.
Service delivery records document what services each student receives. This includes the type of service, provider, frequency, duration, and attendance. Match these records to IEP goals so you can see if students get what their plans require.
Student outcome measures capture progress toward goals. Academic assessments, behavioral data, therapy progress notes, and standardized test scores all matter. The key is consistency. Use the same measures over time so you can spot trends.
Many districts already collect this information. The problem is that it sits in separate systems. Your tracking framework needs to bring it together.
Setting up allocation categories that make sense
Generic budget codes hide important details. “Special education services” tells you nothing about how money gets used.
Create categories that match how you actually work. Break down spending by:
- Service type: speech therapy, occupational therapy, counseling, academic support, behavioral intervention
- Delivery model: push-in support, pull-out sessions, co-teaching, one-on-one aide, resource room
- Grade band: early childhood, elementary, middle school, high school
- Disability category: specific learning disability, autism, emotional disturbance, other health impairment
- Funding source: local funds, state grants, federal IDEA dollars, Medicaid reimbursement
This level of detail answers real questions. You can see that high school students with autism cost more per capita than elementary students. You discover that co-teaching models produce better outcomes per dollar than pull-out services. You identify which schools need more speech therapists.
Track both direct and indirect costs. Direct costs include salaries for special education teachers, aides, and therapists. Indirect costs cover evaluations, IEP meetings, case management, data systems, and administrative oversight. Most districts underestimate indirect costs by 30% or more.
Creating a tracking workflow that sticks
The best system in the world fails if people do not use it. Design workflows that fit into existing routines.
-
Assign clear ownership for each data type. Special education teachers log service delivery. Therapists enter session notes. Finance staff import expenditure data. Nobody should wonder whose job it is.
-
Set regular update schedules. Daily entry works for service logs. Weekly updates make sense for therapy notes. Monthly reviews catch budget variances before they spiral. Quarterly reports go to leadership.
-
Build validation checks into the process. Flag missing data automatically. Alert coordinators when service hours do not match IEP requirements. Highlight budget lines trending over or under projections.
-
Make data entry as simple as possible. Use dropdown menus instead of free text. Pre-populate student information. Allow bulk updates for recurring services. The easier you make it, the more accurate your data becomes.
-
Close the feedback loop. Show teachers and therapists how their data gets used. Share reports that prove program value. When people see their input making a difference, they keep contributing.
Monitoring distribution and equity
Raw spending numbers miss the point. You need to know if resources reach the students who need them most.
Calculate per-student spending across different groups. Compare schools, grade levels, and disability categories. Look for patterns that signal inequity.
Some variation makes sense. Students with severe disabilities require more intensive services. But watch for red flags. One elementary school spends twice as much per student as another similar school. High school students get half the therapy hours of middle schoolers despite similar needs. Low-income schools have less experienced special education staff.
These patterns often have explanations. They might also reveal problems you can fix. Maybe one school has outdated IEPs that over-prescribe services. Perhaps another school needs help writing better evaluations. You cannot address what you cannot see.
Track wait times and service gaps too. How long do students wait for initial evaluations? For reevaluations? To start receiving services after eligibility? Long delays waste time and violate legal requirements. They also cost money when compensatory services become necessary.
“The districts that manage special education budgets most effectively track three metrics religiously: cost per student by service type, time from referral to service delivery, and percentage of IEP goals met on schedule. Everything else flows from those fundamentals.”
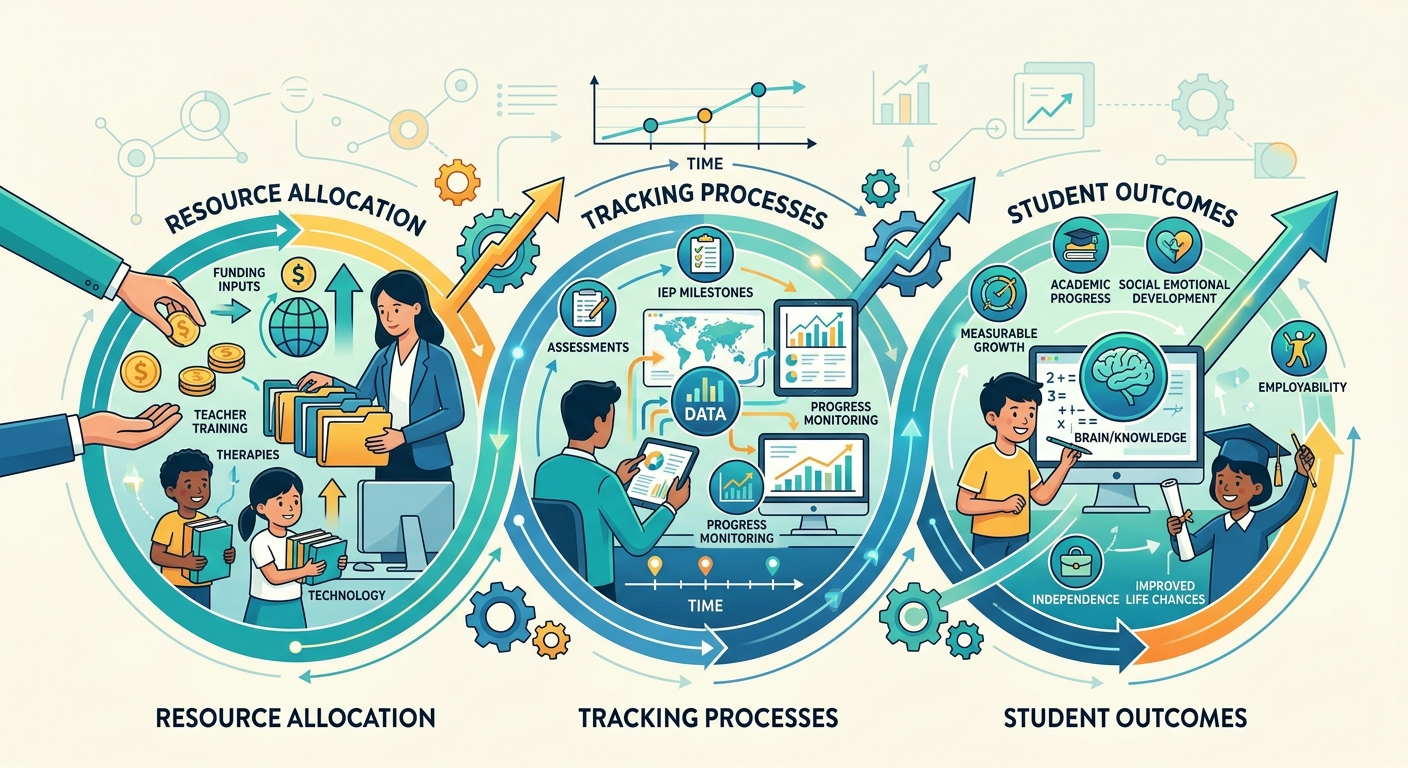
Connecting spending to student outcomes
Money matters only if it helps students. Link your resource allocation data to outcome measures.
Start simple. For each major service type, track basic progress indicators:
| Service Type | Input Metric | Outcome Metric | Efficiency Ratio |
|---|---|---|---|
| Speech therapy | Hours per week | Goals met per semester | Cost per goal achieved |
| Reading intervention | Sessions attended | Reading level gains | Spending per grade level increase |
| Behavioral support | Aide hours provided | Incident reduction rate | Cost per incident avoided |
| Occupational therapy | Treatment minutes | Skills mastered | Investment per skill milestone |
This table format helps you spot what works. You might find that 30-minute speech sessions twice weekly produce better results than 60-minute weekly sessions at the same total cost. Or that behavioral aides prevent more incidents when they work with multiple students in a classroom than when assigned one-to-one.
Look for diminishing returns. Adding a second hour of daily reading intervention might help. A third hour probably wastes money that could help other students.
Track outcomes at multiple time scales. Immediate progress toward IEP goals matters. So does long-term success: graduation rates, post-secondary enrollment, independent living skills, employment outcomes for transition-age students.
Using data to make better decisions
Good tracking data answers questions before you ask them. It should guide three types of decisions.
Resource reallocation during the year. When you see spending patterns in real time, you can shift resources to where they help most. A school burns through its aide budget by January because student needs changed. Another school has surplus speech therapy hours. Your tracking system shows both situations. You can reassign staff or adjust contracts before problems grow.
Budget planning for next year. Historical data reveals true costs. You know exactly what each program required, not what you guessed in last year’s budget. You can project needs based on incoming student populations and service trends. Your budget requests come with evidence, not hunches.
Program evaluation and improvement. Compare different service delivery models. Test whether new interventions justify their cost. Identify which schools get the best outcomes and learn what they do differently. Data turns opinions into facts.
Share findings with stakeholders. School boards understand charts showing cost per student outcome better than line-item budgets. Parents appreciate transparency about how resources get distributed. Teachers need feedback showing that their documentation matters.
Common tracking mistakes to avoid
Even well-intentioned tracking systems go wrong. Watch for these traps.
Collecting data nobody uses. Every field you track should answer a specific question or inform a real decision. If you cannot explain why you need a data point, stop collecting it.
Tracking inputs but ignoring outcomes. Knowing that you spent $500,000 on reading intervention means nothing without knowing if reading scores improved. Always pair resource data with results data.
Updating systems irregularly. Stale data breeds bad decisions. Set firm deadlines and hold people accountable. Monthly financial reviews catch budget problems while you can still fix them.
Ignoring data quality. Garbage in, garbage out. Build validation rules. Audit records quarterly. Train staff on accurate entry. One person entering therapy sessions as 30 minutes when they actually run 45 minutes throws off your entire cost analysis.
Making systems too complex. If your tracking requires a PhD to understand, people will not use it. Simple, consistent categories beat elaborate coding schemes every time.
Forgetting about privacy. Student-level tracking must comply with FERPA and state privacy laws. Limit access to identifiable data. Aggregate reports for general audiences. Train staff on confidentiality requirements.
Technology that actually helps
You do not need expensive enterprise software to track resources well. But you do need systems that talk to each other.
Look for platforms that integrate financial data, student information, and service logs. Many special education management systems now include resource tracking modules. They pull student data from your SIS, link to service logs, and connect with your finance system.
Key features worth having:
- Automated data imports from existing systems
- Customizable dashboards showing real-time spending and service delivery
- Alert systems for budget variances and compliance issues
- Report builders that let you analyze data without IT help
- Mobile access for teachers and therapists to log services on the go
- Audit trails showing who entered or changed data
Cloud-based systems work better than local installations. They update automatically. Multiple users can access them simultaneously. You can check budget status from anywhere.
But technology is just a tool. It magnifies good processes and exposes bad ones. Fix your workflows before you buy software. Otherwise you just automate dysfunction.
Reporting that drives action
Raw data does not persuade anyone. Turn your tracking information into clear reports that prompt decisions.
Create a monthly dashboard for principals showing their school’s special education spending, service delivery rates, and outcome trends. Keep it to one page. Use charts, not tables. Highlight items needing attention.
Build quarterly reports for district leadership comparing schools and programs. Show spending per student, service delivery rates, progress toward IEP goals, and year-over-year trends. Include brief analysis explaining what the numbers mean.
Prepare annual comprehensive reviews documenting program effectiveness. This becomes your evidence base for budget requests, program changes, and strategic planning.
Make reports visual. A line chart showing rising costs alongside flat outcomes tells a story instantly. A map showing service distribution across schools reveals equity gaps at a glance. Color-coded tables draw eyes to outliers.
Always include context. Spending increased 12% sounds bad until you note that student enrollment grew 15%. One school’s high per-student costs make sense when you see they serve the district’s most intensive needs.
Planning for continuous improvement
Tracking systems evolve. Your first version will have gaps. That’s fine. Start with core data and expand gradually.
Review your tracking processes twice yearly. Ask users what works and what frustrates them. Look for data you collect but never use. Identify questions you cannot answer with current information.
Update categories as programs change. When you launch a new service model, create tracking codes for it from day one. When you eliminate a program, archive its data properly for historical analysis.
Train new staff thoroughly. Every special education teacher, therapist, and aide should understand how their documentation feeds the larger system. Show them reports based on their data. Explain how accurate tracking protects program funding.
Benchmark against other districts when possible. State departments of education often publish special education spending data. Regional cooperatives sometimes share anonymized metrics. See how your costs and outcomes compare. Learn from districts doing better.
Making tracking part of your culture
The best tracking happens when it becomes routine, not a special project someone champions.
Build it into supervision. When you meet with special education coordinators, review their school’s tracking data together. Discuss trends. Celebrate improvements. Address gaps.
Include tracking metrics in program evaluations. When you assess whether an intervention works, look at its cost-effectiveness alongside its outcomes. Make resource efficiency part of how you define success.
Share wins publicly. When tracking data helps you make a smart reallocation, tell people. When your budget request succeeds because you had solid evidence, credit the tracking system. Positive reinforcement builds buy-in.
Address problems directly. If a school consistently submits incomplete data, find out why. Do they need training? Different software? More time? Help them solve it rather than just demanding compliance.
Putting your system to work
Special education resource allocation tracking sounds technical. At its heart, it’s about making sure kids get what they need.
Good tracking shows you where money goes, whether services reach students, and if those services make a difference. It turns budget management from guesswork into evidence-based practice.
Start small if you need to. Pick one program or one school. Get the core data flowing. Prove the value. Then expand.
The time you invest in tracking pays back many times over. You make smarter decisions faster. You justify budgets with confidence. You catch problems early. Most importantly, you ensure that every dollar serves students well.
Your tracking system becomes your roadmap. It shows where you are, where you need to go, and whether you’re making progress. Build it carefully, use it consistently, and let it guide you toward better outcomes for every student you serve.

Post Comment