Tracking 25 Years of Hong Kong’s Gini Coefficient: What the Data Says About Long-Term Inequality
For the last quarter century, Hong Kong has been a living laboratory for how economic growth interacts with income distribution. The territory transformed from a manufacturing hub into a global finance center, weathered the Asian Financial Crisis, navigated the 2008 global recession, and absorbed the shocks of a pandemic. Through all of that, one number has quietly tracked the widening gap between the city’s richest and poorest residents: the Gini coefficient.
The data shows a story that is both complex and troubling. Since the handover in 1997, Hong Kong’s Gini coefficient has stayed stubbornly high by international standards. It has not followed a straight line upward. Instead, it has moved in waves, rising sharply during some periods and holding steady during others. But the overall direction is clear. The gap between high earners and low earners has grown wider across a generation.
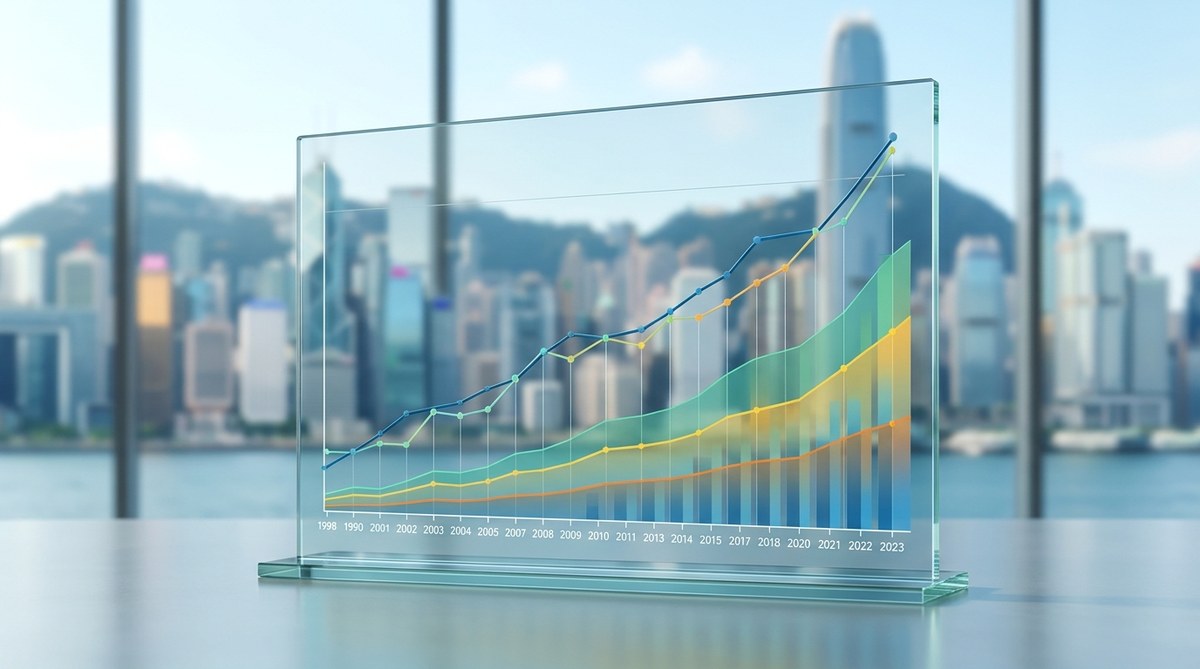
Hong Kong’s Gini coefficient rose from roughly 0.45 in the late 1990s to a peak above 0.49 in the 2010s before settling near 0.47 in the 2020s. That places the territory among the most unequal developed economies globally. The data reveals that structural factors like deindustrialization, housing costs, and demographic aging have locked inequality into the system, making it resistant to short term policy fixes.
What the Gini Coefficient Actually Measures
Before we dig into the numbers, it helps to understand what the Gini coefficient represents. Think of it as a single score between 0 and 1. A score of 0 means perfect equality, where everyone has the same income. A score of 1 means total inequality, where one person has all the income and everyone else has nothing.
In practice, no society scores a perfect 0 or 1. Most developed economies fall somewhere between 0.25 and 0.40. The United States typically sits around 0.41. Nordic countries like Sweden and Norway often record scores below 0.28. Hong Kong has consistently registered above 0.44 since records began after the handover.
The Gini captures something that average income figures miss. Two economies can have the same average income but very different Gini scores. That difference tells you whether the economic pie is being shared broadly or concentrated at the top.
Tracking the Numbers: Hong Kong’s Gini Over 25 Years
The Hong Kong Census and Statistics Department has published household income inequality data since 1997. The numbers show several distinct phases.
| Period | Approximate Gini Range | Key Economic Context |
|---|---|---|
| 1997 to 2002 | 0.45 to 0.47 | Post handover adjustment, Asian Financial Crisis |
| 2003 to 2008 | 0.47 to 0.49 | Mainland integration, rapid finance sector growth |
| 2009 to 2014 | 0.48 to 0.50 | Global financial crisis recovery, low interest rate environment |
| 2015 to 2019 | 0.47 to 0.49 | Housing cost explosion, social unrest |
| 2020 to 2026 | 0.46 to 0.48 | Pandemic disruption, population outflow, economic restructuring |
The table above simplifies a complex picture, but the trend lines are real. The Gini coefficient rose sharply in the first decade after the handover. It peaked in the early 2010s. Since then, it has eased slightly but remains at a level that signals deep structural inequality.
Why the Gini Rose So Fast After 1997
Hong Kong’s inequality did not appear overnight. It was built into the economic transformation that followed the handover. Three forces drove the initial rise.
First, deindustrialization hit low skilled workers hard. Manufacturing jobs that once provided stable middle class wages moved across the border into mainland China. Those workers who could not transition into the service sector found themselves competing for lower paying roles in retail, hospitality, and domestic work.
Second, the finance and professional services sector exploded. Hong Kong positioned itself as the gateway for capital flowing into and out of China. Bankers, lawyers, and fund managers saw their incomes rise dramatically. This pulled the top end of the income distribution far away from the middle.
Third, housing costs began their long climb. Real estate became the dominant store of wealth in Hong Kong. Homeowners saw their net worth balloon while renters faced ever increasing monthly costs. Since housing is such a large share of household expenditure in Hong Kong, this directly widened the gap between those who owned property and those who did not.
These three forces did not just raise the Gini. They changed the structure of Hong Kong’s economy in ways that made inequality self reinforcing.
The Plateau That Wasn’t a Recovery
Around 2015, some analysts noticed that Hong Kong’s Gini coefficient had stopped rising. It hovered around 0.48 and even dipped slightly. A few commentators suggested that inequality had peaked and that policy interventions were working.
That interpretation turned out to be too optimistic. The plateau did not come from rising incomes at the bottom. It came from falling incomes at the top. The finance sector faced headwinds. Trade tensions between the United States and China reduced deal flow. The luxury property market cooled. High earners saw their bonuses shrink.
Meanwhile, low income households were not catching up. Their wages remained stagnant. Their housing costs kept climbing. The Gini plateau was a pause, not a correction. When the pandemic hit in 2020, the numbers shifted again, but not in a way that signaled genuine improvement.
“A Gini coefficient that stays flat while the cost of housing rises and real wages for the bottom quartile decline is not a sign of health. It is a sign that the economy is squeezing everyone except the very top, and even the top is feeling the pinch.”
Dr. Lina Wong, Hong Kong Institute of Social Research
How Hong Kong Compares Internationally
Hong Kong’s Gini coefficient history places it in uncomfortable company. Among developed economies, only the United States and Singapore regularly post similar numbers. Most European nations, Japan, South Korea, and Australia all have lower Gini scores.
The comparison is useful because it shows that high inequality is not inevitable. Other wealthy societies have found ways to maintain growth while keeping income gaps narrower. Hong Kong’s unique features, its small land area, its reliance on property wealth, its light tax regime, and its limited social safety net, all contribute to the persistent gap.
That said, direct international comparisons require caution. Different countries measure income differently. Some adjust for household size. Some include taxes and transfers. Some do not. The Hong Kong data uses household income before taxes and transfers, which makes the Gini look higher than it would under an after tax measure.
The Missing Piece: Wealth vs. Income
The Gini coefficient measures income inequality. It does not capture wealth inequality. That distinction matters enormously in Hong Kong.
Income is what you earn each year from work and investments. Wealth is what you own, property, stocks, savings, and assets. In Hong Kong, wealth inequality is far more extreme than income inequality. The housing market alone creates a massive divide. A household that bought a flat in 2005 has seen its net worth rise by several million Hong Kong dollars. A household that never entered the market has seen its net worth stay flat or even decline relative to inflation.
The Gini coefficient history tells us about the flow of money. It does not tell us about the stock of assets. When researchers factor in housing wealth, the picture of inequality in Hong Kong becomes even starker.
What Drove the Recent Dip in Inequality
Between 2020 and 2024, Hong Kong’s Gini coefficient dropped from around 0.48 to about 0.46. That is a meaningful move. But the reasons behind it are not comforting.
The drop was driven primarily by two factors. First, many high income earners left Hong Kong during and after the pandemic. The finance sector saw an exodus of expatriate professionals and wealthy mainland Chinese families. Their departure reduced the top end of the income distribution, which mechanically lowered the Gini.
Second, government pandemic relief payments provided a temporary boost to low income households. One off subsidies and wage support programs pushed up the bottom end of the distribution. That also lowered the Gini.
Neither of these factors represents a sustainable improvement in equality. The underlying structure of the economy, the dominance of finance, the high cost of housing, and the weak social safety net, remained unchanged. When the relief payments ended and the economy stabilized, the Gini began to edge back up.
Three Things the Gini Does Not Tell Us
Relying on the Gini coefficient alone can lead to incomplete conclusions. Researchers and policy analysts should keep three limitations in mind.
-
The Gini does not show where the middle class stands. A society can have a moderate Gini if the middle class is shrinking. The top grows, the bottom grows, and the middle hollows out. The Gini might stay the same even as social stability weakens.
-
The Gini is insensitive to changes at the very top. It takes a large shift in the income share of the top 1% to move the Gini meaningfully. Small changes at the top can hide big shifts in economic power.
-
The Gini ignores demographic change. Hong Kong’s population is aging rapidly. Older households often have lower incomes but higher wealth. A rising Gini could partly reflect an aging population rather than worsening economic conditions for working age families.
How to Read the Data Responsibly
For academic researchers and policy analysts, the Gini coefficient is a starting point, not a final answer. Here is a practical approach to using the data.
- Start with the official Census and Statistics Department data. It is the most reliable source for Hong Kong Gini coefficient history.
- Compare the Gini with other indicators like the poverty rate, the Palma ratio, and the 90/10 percentile ratio. Each tells a different part of the story.
- Look at the data by demographic group. The Gini for households with children looks different from the Gini for elderly households.
- Adjust for housing costs. A family with 50,000 HKD in annual income but no housing costs is in a very different position than a family with the same income paying 40,000 HKD in rent.
- Track the trend, not the single year number. Year to year fluctuations can come from survey sampling errors or one off events. The five year moving average is more informative.
What Policymakers Can Learn From 25 Years of Data
The long term data offers clear lessons for anyone designing social policy in Hong Kong.
First, economic growth alone does not reduce inequality. Hong Kong grew rapidly for most of the last 25 years, and inequality rose alongside that growth. The idea that a rising tide lifts all boats does not hold in an economy where the boats are structurally separated.
Second, housing policy is inequality policy. The single biggest driver of the gap between rich and poor in Hong Kong is the cost of shelter. Without meaningful reform to the housing market, other interventions will have limited effect.
Third, tax and transfer systems matter. Hong Kong’s low tax regime keeps government revenue small. That limits the government’s ability to redistribute income through cash transfers, public services, or infrastructure investment in poorer districts.
Fourth, the working poor need targeted support. Hong Kong has a significant population of employed individuals who still live below the poverty line. Minimum wage increases have helped, but they have not kept pace with the cost of living.
The Social Development Index Connection
The Gini coefficient is one of several indicators tracked by the Social Development Index. That broader framework places income inequality alongside measures of health, education, housing, and social participation. The index shows that high inequality correlates with worse outcomes across multiple dimensions.
When the Gini is high, life expectancy gaps between districts widen. Educational attainment becomes more tied to family income. Mental health outcomes deteriorate. Social trust erodes. The Gini is not just an economic statistic. It is a signal about the overall health of the society.
What to Watch in the Coming Years
As of 2026, several factors will shape Hong Kong’s Gini coefficient history going forward.
The population outflow has slowed but not stopped. If high income earners continue to leave, the Gini may stay suppressed. But that is not a desirable form of equality. It represents a loss of economic dynamism and tax base.
Housing prices have corrected somewhat from their 2021 peak but remain extremely high relative to incomes. Until the housing market becomes more accessible, inequality will remain baked into the system.
The aging population will put pressure on public finances. An older population requires more healthcare spending and pension support. If the government funds these through broad based taxes, it could reduce inequality. If it cuts services instead, inequality could rise.
The shift toward a knowledge based economy favors workers with higher education. Low skilled workers face diminishing opportunities. Without investment in retraining and education, the income gap will continue to widen.
A Data Set Worth Watching
For anyone serious about understanding Hong Kong’s social development, the Gini coefficient history is essential reading. It is not a perfect measure. No single number can capture the full complexity of inequality. But it is a reliable starting point for asking better questions.
The data shows that Hong Kong has been running a natural experiment in high inequality for a generation. The results are now visible in the housing crisis, the aging population’s financial insecurity, the struggles of young families, and the growing sense that the system favors those who already have wealth.
The next 25 years do not have to look like the last 25. But changing the trajectory will require policies that address the structural drivers of inequality, not just the symptoms. That means reforming housing, strengthening the social safety net, investing in education and retraining, and creating a tax system that can fund those investments.
Where the Data Leads Us Next
The Gini coefficient tells us where we have been. It is up to researchers, advocates, and policymakers to decide where we go next. The numbers are clear. The gap between Hong Kong’s richest and poorest residents has grown across a generation. Closing that gap will take another generation of sustained effort. But the first step is understanding the data.
Use these numbers as a foundation. Pair them with district level poverty data, with housing cost trends, with employment statistics, and with demographic projections. The more complete the picture, the more effective the response can be. And the more likely it is that Hong Kong’s next 25 years will be more equitable than the last 25.


Post Comment