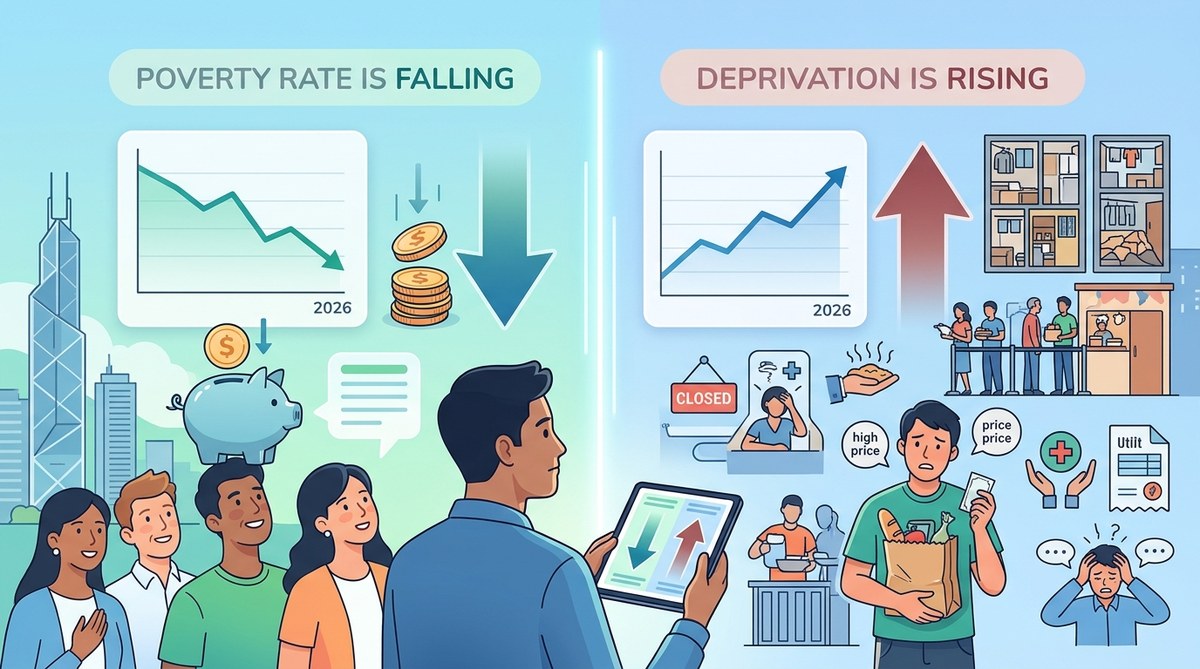
Why Hong Kong’s Poverty Rate Is Falling but Deprivation Is Rising in 2026
Hong Kong’s official poverty rate has been dropping. That is the headline. But if you talk to social workers, visit community kitchens, or look at the number of families skipping meals, a different story emerges. More people say they cannot afford basic necessities today than they could five years ago. How can both things be true?
The answer lies in how we measure poverty. The official rate tracks income against a threshold. But income is only part of the picture. When rents climb, when medical costs surge, and when wages barely move, a household can cross above the poverty line on paper while falling deeper into material hardship. This is the paradox of Hong Kong poverty rate vs deprivation in 2026.
Hong Kong’s falling poverty rate hides a worsening deprivation crisis. Income-based measures miss rising costs for housing, healthcare, and education. A family can earn just enough to exit official poverty yet still lack adequate nutrition, stable shelter, or medical care. Policymakers must track both income and material hardship to see the full picture.
The Numbers That Don’t Add Up
Let us start with the data. The Census and Statistics Department reported that Hong Kong’s poverty rate fell to roughly 8.9 percent in 2025, down from a peak of around 12.5 percent during the pandemic years. That sounds like good news. More people have jobs. Wages have inched upward. The economy has stabilized.
But look at the deprivation indicators tracked by the Social Development Index. The proportion of households reporting that they could not afford to replace worn-out furniture rose. The share of families who could not pay for a one-week annual holiday away from home increased. More troubling, the number of residents who skipped meals because of cost went up.
This is not a contradiction. It is a warning.
Why Income Poverty Falls While Deprivation Rises
The gap between the two measures comes down to three main forces.
- Housing costs eat up wage gains. Hong Kong’s rental market has not cooled. Even with modest income growth, a family that pays 40 to 50 percent of its earnings on rent has little left for everything else. A small raise can push them above the poverty line, but it does not cover the rising cost of a subdivided flat.
- Essential non-housing costs are rising faster than inflation. Medical expenses, utility bills, and education costs have all climbed. The Consumer Price Index for general goods may show moderate inflation, but the basket of goods that low-income households buy is different. They spend a larger share on rent, transport, and healthcare. Those categories have seen steeper price increases.
- The poverty line is a blunt instrument. Hong Kong sets its poverty line at 50 percent of median household income. When median income rises, the line moves up. But many households stay just above it while still struggling to afford basics. They are counted as non-poor, but they live with constant financial stress.
For a deeper look at how the official measure falls short, read our article on 7 critical indicators that define poverty in Hong Kong beyond income levels.
What Deprivation Looks Like in 2026
The Hong Kong Social Development Index tracks multiple deprivation indicators. Here are the most striking changes over the past three years.
| Indicator | 2023 | 2025 | Change |
|---|---|---|---|
| Could not afford to replace worn-out furniture | 14% | 18% | +4% |
| Could not afford a one-week holiday | 22% | 26% | +4% |
| Skipped meals due to cost | 5% | 8% | +3% |
| Could not pay utility bills on time | 11% | 15% | +4% |
| Could not afford new clothes | 16% | 19% | +3% |
These numbers come from household surveys conducted by the University of Hong Kong’s Social Work Department. They show a clear pattern. More families are cutting back on essentials. They are not just skipping luxuries. They are skipping meals.
The Working Poor Are Not Escaping
One of the most persistent myths is that employment solves poverty. It does not. Not in Hong Kong. The city has a large population of working poor. These are people with jobs, sometimes multiple jobs, who still cannot make ends meet.
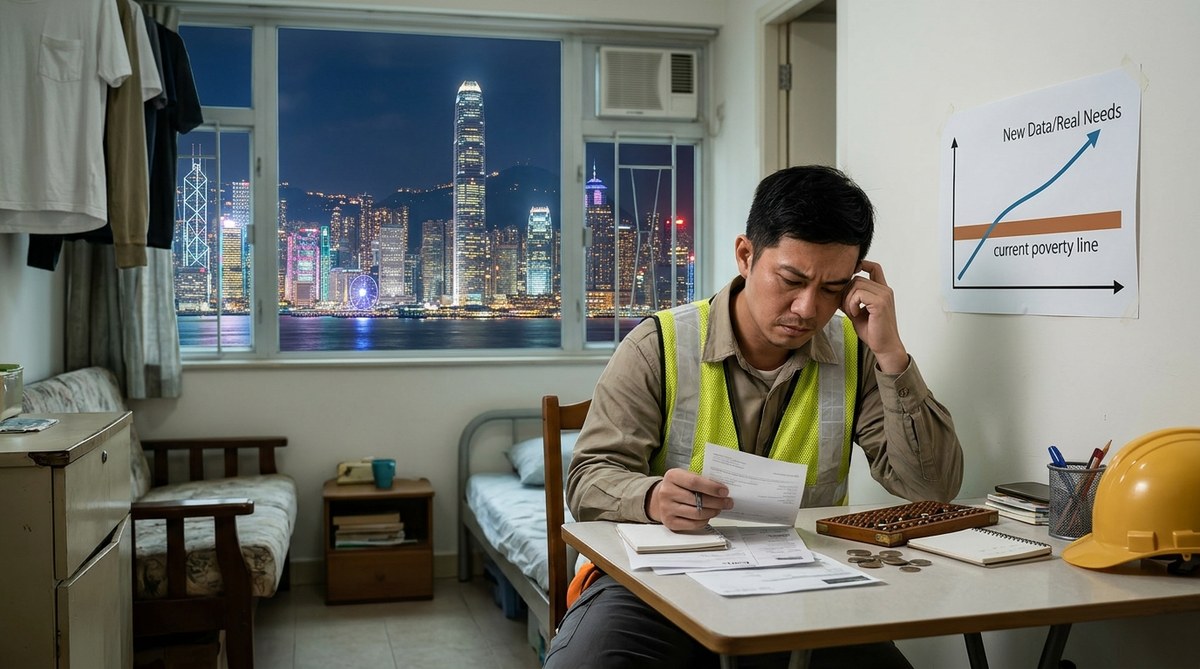
A cleaner working full time in Central might earn HKD 14,000 per month. That is above the poverty line for a single person. But after paying rent for a subdivided flat in Sham Shui Po, buying transport passes, and covering basic food costs, there is almost nothing left. If a child gets sick or a parent needs care, the budget breaks.
We explored this in detail in our piece on understanding the working poor: employment statistics that challenge common assumptions. The data shows that in-work poverty has remained stubbornly high even as the overall poverty rate fell.
How to Spot the Real Trends: A Practical Guide
If you are a researcher or policy analyst, you need to look beyond the headline poverty rate. Here is a simple process.
- Start with the official poverty rate. Get the latest figure from the Census and Statistics Department. Note the year and the poverty line used. This gives you a baseline.
- Cross-reference with the Social Development Index. The Index includes 10 deprivation indicators. Look for trends in material hardship, not just income. If deprivation is rising while poverty falls, you have identified the paradox.
- Check housing cost data. The Rating and Revenue Department publishes median rents by district. Compare rent growth to income growth. If rents are rising faster, poverty measures will understate hardship.
- Review the Consumer Price Index for low-income households. The government does not publish a separate CPI for the poor, but you can approximate it by weighting categories like housing, food, and transport more heavily.
- Talk to frontline service providers. Food bank usage, charity clinic visits, and utility assistance applications are real-time indicators. They often move before official statistics do.
For those who want to go deeper, our guide on the complete guide to interpreting social development data for policy advocacy offers a full methodology.
Why the Gap Matters for Policy
If policymakers only track the poverty rate, they will miss the growing crisis of deprivation. They might conclude that the economy is working for everyone. It is not.
Consider two households.
Household A earns HKD 22,000 per month. They live in a public housing flat with subsidized rent. They have enough left for food, transport, and some savings. They are above the poverty line and report low deprivation.
Household B earns HKD 24,000 per month. They rent a subdivided flat in Kowloon for HKD 10,000. After rent, utilities, and transport, they have about HKD 9,000 left for a family of three. That is below HKD 3,000 per person for food, clothing, education, and healthcare. They are above the poverty line, but they are deprived.
The poverty rate says Household B is fine. The deprivation indicators say they are struggling. Which measure should guide policy?
The answer is both. Income-based poverty measures are useful for tracking broad economic trends. Deprivation indicators capture the lived experience. A smart policy response would include:
- Rent control or expanded public housing to lower the biggest household cost.
- A broader definition of poverty that includes housing-adjusted income.
- Targeted subsidies for low-income families on utilities, transport, and medical care.
We analyzed the effectiveness of similar approaches in does social welfare spending reduce poverty? analyzing two decades of evidence. The findings suggest that cash transfers alone are not enough. The cost of essentials must be addressed directly.
The Hidden Cost of Living Crisis
The phrase “cost of living crisis” gets thrown around a lot. But in Hong Kong, it is measurable. Since 2010, the cost of essential expenses has grown much faster than wages for the bottom 40 percent of earners.
Rent is the biggest driver. But healthcare is catching up. A visit to a public hospital may be subsidized, but wait times are long. Many low-income families turn to private clinics for basic care, paying out of pocket. Dental care is almost entirely private. A single dental visit can cost a week’s wages for a minimum wage worker.
Education is another pressure point. Even in public schools, parents face costs for uniforms, books, exam fees, and tutoring. The pressure to keep up academically pushes families into debt. We tracked this trend in the rising cost of private tutoring: what the data tells us about Hong Kong families.
When a family has to choose between paying rent, buying medicine, or covering school fees, deprivation sets in. It does not matter if their income is technically above the poverty line. They are still living in poverty by any meaningful standard.
A Broader View of Social Progress
The Social Development Index exists precisely to capture these hidden struggles. It combines income data with health, education, housing, and social participation indicators. The Index has shown a slow but steady decline in overall social wellbeing since 2019, even as GDP recovered.
This is a critical finding. Economic output can grow while social conditions deteriorate. The Index captures that divergence. For anyone tracking Hong Kong’s social health, the Index is an essential tool.
Read our overview of how Hong Kong’s social development index reveals hidden inequality patterns for a full breakdown.
What the 2026 Data Tells Policymakers
The message from 2026 is clear. Do not celebrate the falling poverty rate too soon. Look at the deprivation indicators. Look at the rising number of families who cannot afford basic necessities. Look at the growing gap between what people earn and what they need to live with dignity.
The policy response must be multi-layered.
- Expand the definition of poverty. Include housing costs in the calculation. A family that pays half its income on rent is poor, even if their pre-rent income looks adequate.
- Invest in social housing. The waiting list for public housing is years long. More supply would free up income for other essentials.
- Cap essential cost increases. Utilities, transport, and basic food items should be monitored and regulated to prevent price spikes that hurt the most vulnerable.
- Improve data collection. The government should publish a regular deprivation index alongside the poverty rate. This would give the public and policymakers a more complete picture.
We explore similar reforms in 5 key economic reforms that could reduce poverty in Hong Kong by 2030.
Rethinking Success
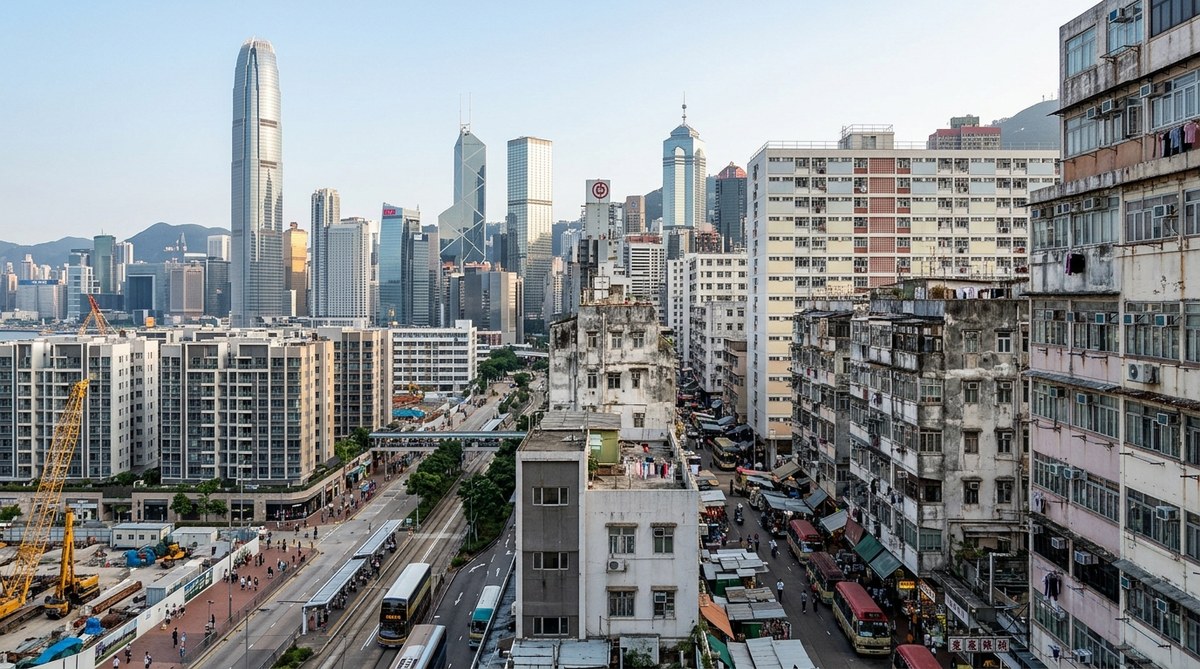
Hong Kong prides itself on being a wealthy city. Its GDP per capita is among the highest in the world. But wealth does not trickle down evenly. The falling poverty rate masks a reality where more people are struggling to afford the basics.
The paradox of Hong Kong poverty rate vs deprivation in 2026 is not a statistical glitch. It is a signal. It tells us that our measures of success are incomplete. A city can have a low poverty rate and still have widespread deprivation. It can have economic growth and still have rising hardship.
For researchers, this means digging deeper. For policymakers, it means broadening the lens. For everyone else, it means recognizing that the numbers we see in headlines do not always reflect the lives people live.
The next time you see a report saying poverty is falling, ask what it is not measuring. Ask about rent. Ask about healthcare costs. Ask about the family who just got a raise but still cannot afford to fix their broken refrigerator. Those are the stories behind the statistics.
We will continue to track these trends through the Social Development Index. If you want to stay informed, follow our updates on tracking two decades of social change through Hong Kong’s development index. The data is there. We just have to be willing to look at it from every angle.


Post Comment