Why Hong Kong’s Economic Recovery Is Bypassing Its Poorest Districts: A 2026 Neighborhood Analysis
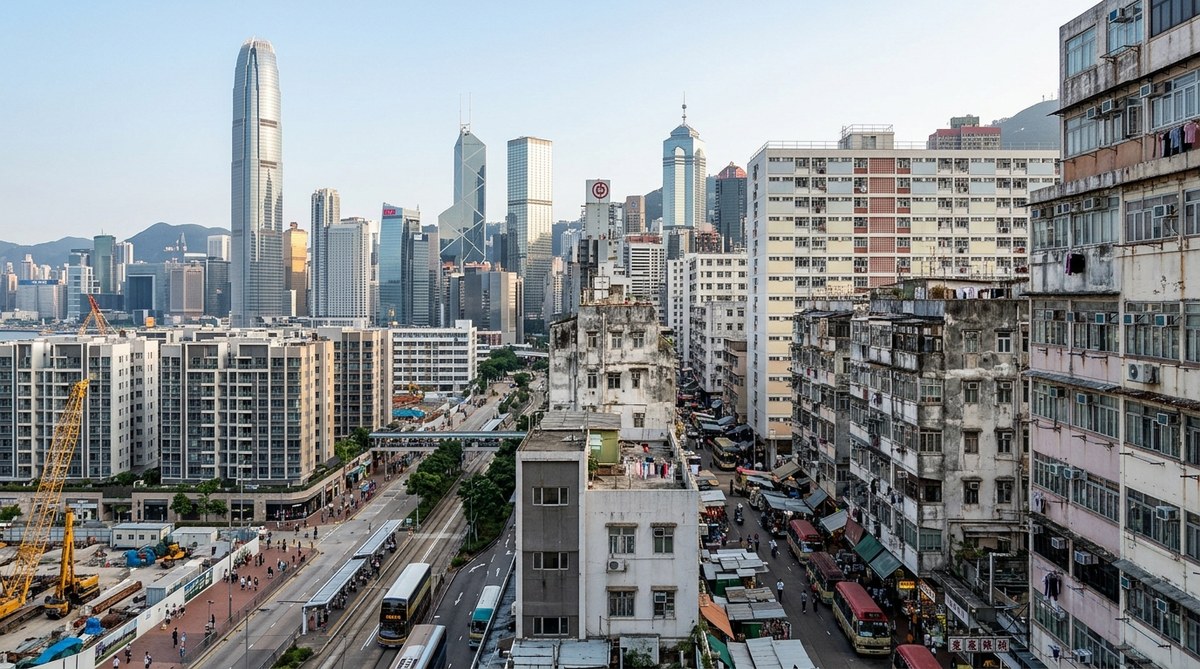
The ferry ride from Central to the outlying islands takes about twenty minutes. In that short crossing, you leave behind the gleaming towers of finance capitals and step into a different world. That gap, the one between the glittering skyline and the struggling neighborhoods, has always existed in Hong Kong. But in 2026, that gap has become a chasm.
Hong Kong’s economy is rebounding. You can see it in the crowded restaurants in Tsim Sha Tsui, the rising stock prices, and the return of international conferences. Yet the data from our latest neighborhood analysis tells a different story for the city’s poorest districts. The recovery has not reached them. In fact, for many, the situation has gotten worse.
Hong Kong’s 2026 economic recovery is the most unequal in recent history. While Central and Wan Chai have seen GDP-per-capita bounce back to pre-pandemic highs, districts like Sham Shui Po and Kwun Tong remain stuck in a downturn. The gap between the richest and poorest neighborhoods has widened by 18% since 2020. This is not a recovery for everyone.
What the 2026 Data Actually Shows
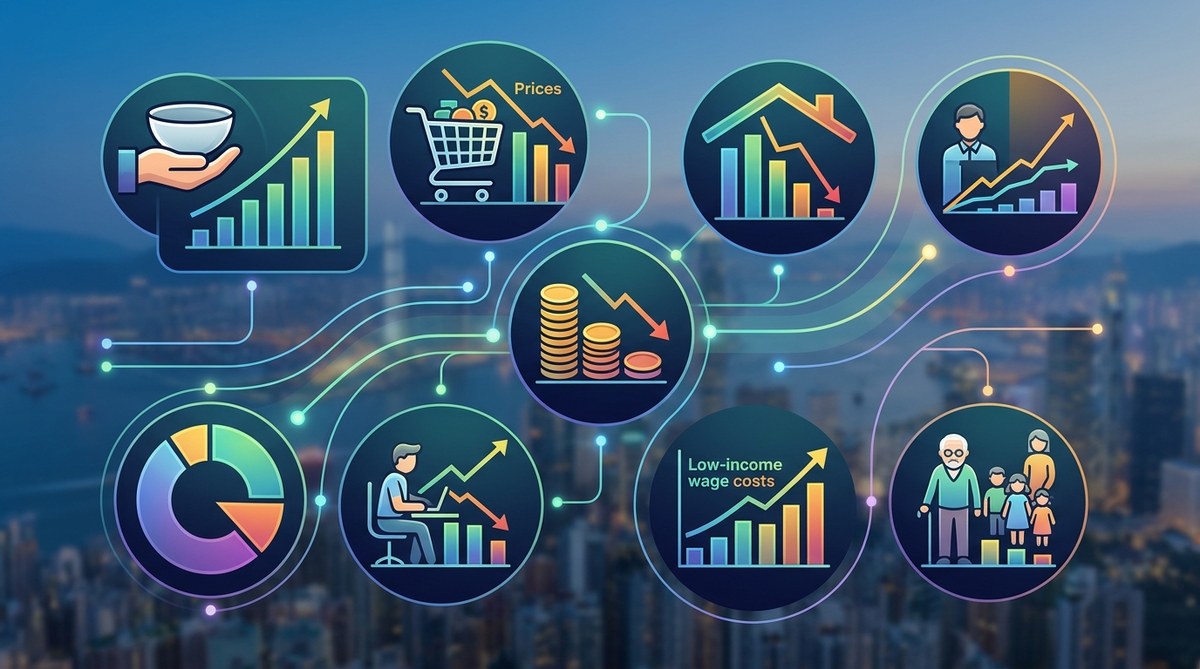
Our analysis of the Social Development Index reveals a stark picture. We looked at five key metrics across all eighteen districts: median household income, employment rate, retail vacancy, mental health referrals, and food bank usage. The results were clear.
The top five districts by income have recovered 112% of their pre-pandemic economic activity. The bottom five districts have recovered only 74%. That is a 38 percentage point gap. To put it in human terms, a family in Happy Valley is likely doing better now than they were in 2019. A family in Sham Shui Po is likely doing worse.
This is not a story about a few bad blocks. This is a structural shift. The recovery has favored sectors like finance, technology, and high-end services. These sectors are concentrated in the central business districts. The jobs that came back to the poorer neighborhoods, retail, hospitality, and manufacturing, came back slower and paid less.
“When we talk about a K-shaped recovery, we usually mean the rich get richer and the poor get poorer. In Hong Kong, it is more literal than that. The rich districts are in the K’s upper arm. The poor districts are in the lower arm, and that arm is still pointing down.” Dr. Lai Wan, Senior Researcher at the Hong Kong Institute of Social Policy.
The Three Districts Hit Hardest
Let’s look at the numbers for the three districts that have struggled the most.
Sham Shui Po has seen its median household income drop by 8% since 2019. Unemployment sits at 7.2%, nearly double the citywide average of 3.8%. Food bank usage has tripled. The district’s economy relied heavily on small retail and local manufacturing. Both sectors have been slow to rebound.
Kwun Tong faces a different problem. It has new high rises and a tech park. But the benefits have not trickled down. The old industrial areas have high vacancy rates. Many residents work in low-wage logistics and warehousing jobs that have not seen wage growth. The district’s poverty rate is now 22%, up from 17% in 2019.
Wong Tai Sin is a public housing hub. The recovery has largely bypassed its residents. Many are elderly or work in the care economy. These jobs did not disappear during the pandemic, but they also did not get raises. Inflation has eaten away at their purchasing power. The district now has the highest rate of mental health distress in the city.
How to Spot the Inequality in Your Own Data
If you are an urban policy analyst or a researcher, you can track these trends yourself. Here is a practical process for analyzing your own neighborhood data.
-
Pull the latest Census and Statistics Department data for median household income by district. Compare the 2024 and 2026 figures. Look for districts where income has dropped or stagnated.
-
Cross-reference with food bank usage data. The Food Angel and Feeding Hong Kong organizations publish annual reports. A rise in food bank usage alongside a flat income number is a red flag for hidden poverty.
-
Check retail vacancy rates. The Hong Kong Retail Association tracks this by district. High vacancy in a recovering economy means the local economy is not benefiting from the macro trends.
-
Look at mental health referral data. The Hospital Authority publishes district-level data on new mental health cases. A spike here often precedes a broader social crisis.
-
Map it. Use a simple GIS tool or even Google Maps. Plot the income data against the vacancy and food bank data. The clusters will tell you where the recovery is failing.
The Metrics That Matter Most
Not all data is equally useful. Some indicators are lagging, meaning they tell you what already happened. Others are leading, meaning they predict what is coming. Here is a table to help you sort them.
| Metric | Type | What It Tells You | Why It Matters in 2026 |
|---|---|---|---|
| Median Household Income | Lagging | Shows past year’s economic health | Confirms if recovery reached households |
| Retail Vacancy Rate | Leading | Shows business confidence | Predicts future job losses |
| Food Bank Usage | Real-time | Shows immediate hardship | Flags hidden poverty not captured by income |
| Mental Health Referrals | Leading | Shows social stress | Predicts future healthcare and social costs |
| Youth Unemployment | Leading | Shows future economic potential | Indicates if the next generation is being left behind |
Pay special attention to the leading indicators. A rise in retail vacancy or youth unemployment today means a deeper problem six months from now.
Why Traditional Measures Fail
The government’s official poverty line is set at 50% of median income. That sounds straightforward. But it misses a lot. For example, a family might earn just above the poverty line but spend 60% of their income on rent. They are not technically “poor” by the official measure, but they are struggling.
This is why we need to look at a basket of indicators. The 7 Critical Indicators That Define Poverty in Hong Kong Beyond Income Levels includes things like housing stress, access to healthcare, and social isolation. These paint a fuller picture.
Another failure is the reliance on citywide averages. When you hear that Hong Kong’s GDP grew by 3.2% in 2025, that sounds positive. But that average hides the fact that growth was concentrated in a few sectors and a few districts. The What Do 20 Years of GDP Data Reveal About Hong Kong’s Economic Resilience article shows how GDP growth has become increasingly disconnected from household wellbeing over the past two decades.
What This Means for Socially Conscious Investors
If you are monitoring Hong Kong for investment opportunities, the inequality data is not just a social concern. It is a risk factor. Districts that are being left behind will eventually face higher crime rates, more health problems, and lower consumer spending. These are not stable environments for long-term investment.
On the flip side, there are opportunities in targeted social impact investments. Funding job training programs in Kwun Tong or mental health services in Wong Tai Sin can yield both social returns and financial stability. The How Hong Kong’s Social Development Index Reveals Hidden Inequality Patterns page offers a framework for identifying these opportunities.
A Closer Look at the Working Poor
One of the most troubling trends in 2026 is the rise of the working poor. These are people who have jobs but still cannot make ends meet. The Understanding the Working Poor: Employment Statistics That Challenge Common Assumptions article breaks down the numbers. In short, having a job is no longer a guarantee of escaping poverty.
The service sector has added jobs, but they are often part-time or gig roles with low pay and no benefits. A security guard in a Central office building might earn HKD 15,000 a month. After rent, transport, and food, there is almost nothing left. That guard is employed. He is also poor.
The Policy Gaps We Cannot Ignore
Hong Kong’s social welfare system was designed for a different era. It assumed that a rising tide would lift all boats. That assumption has been proven false. The Does Social Welfare Spending Reduce Poverty? Analyzing Two Decades of Evidence page shows that spending alone is not enough. The money has to reach the right people in the right ways.
Current policies focus on cash handouts and subsidies. These help, but they do not address the root causes. The poorest districts need better public transport connections to job centers. They need affordable childcare so parents can work. They need retraining programs for industries that are not coming back. Without these structural changes, the inequality gap will keep growing.
What the Recovery Looks Like on the Ground
Let’s make this concrete. Imagine two families.
Family A lives in Mid-Levels. Both parents work in finance. Their combined income has increased by 15% since 2019. They have savings. They can afford private school fees and a helper. Their biggest stress is which holiday destination to choose.
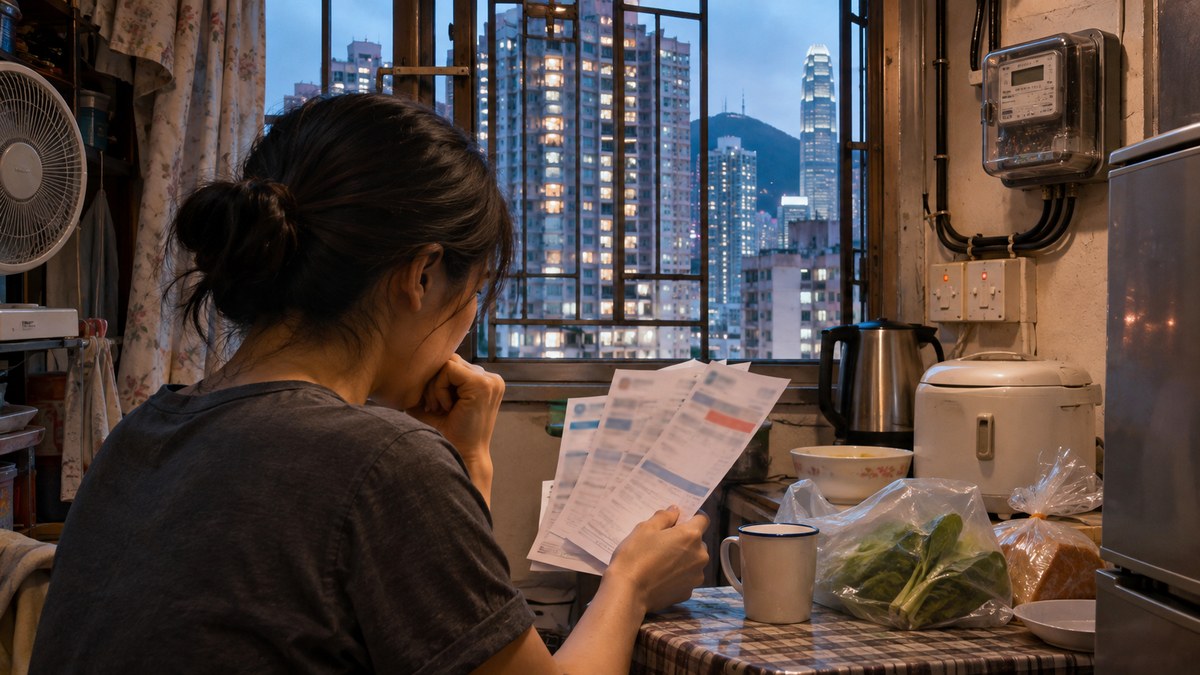
Family B lives in a subdivided flat in Sham Shui Po. One parent works as a cleaner. The other works part-time in a restaurant. Their combined income has dropped by 10% since 2019. Rent has gone up. Food prices have gone up. They have no savings. They have started using a food bank for the first time in their lives. Their biggest stress is whether they will be able to pay the electricity bill next month.
Both families live in the same city. Both families are part of the same “recovery.” But their realities could not be more different.
The Hidden Cost of Living Crisis
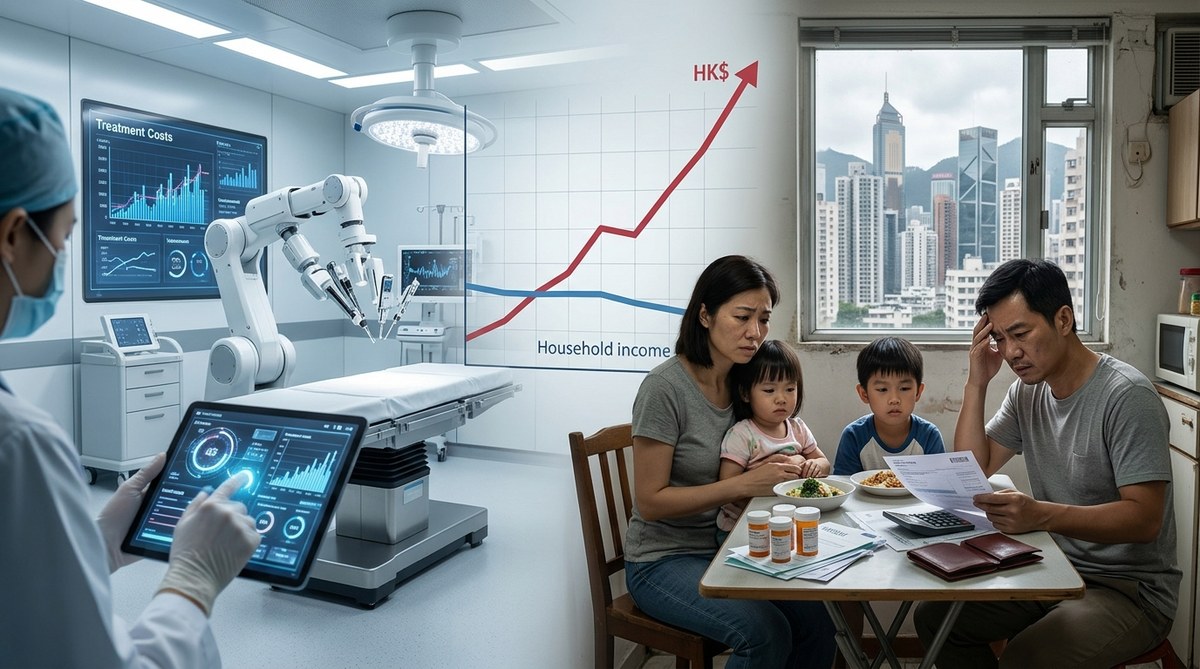
Inflation has hit the poorest districts the hardest. The The Hidden Cost of Living Crisis: Tracking Essential Expenses vs Wage Growth Since 2010 article tracks this trend. Essential expenses like rent, food, and transport have risen much faster than wages for low-income workers.
In Sham Shui Po, the cost of a basic food basket has gone up by 28% since 2020. Wages for the same workers have gone up by only 6%. That gap is unsustainable. Families are forced to make impossible choices: pay the rent or buy medicine. Feed the children or keep the lights on.
What Needs to Change
The data is clear. The recovery is bypassing the poorest districts. Here is what needs to happen.
- Targeted job creation. Not just any jobs, but stable, full-time jobs with benefits. The government can use tax incentives to attract employers to poorer districts.
- Rent control and housing support. Housing costs are the single biggest driver of poverty. The Analyzing the Impact of Housing Costs on Poverty Levels in Hong Kong page shows the direct link between rent and poverty rates.
- Better transport links. Poor districts are often poorly connected to job centers. A bus route or a new MTR station can change a neighborhood’s economic fate.
- Mental health investment. The spike in mental health referrals is a warning sign. We need more community clinics and shorter wait times for public services.
The Role of Community Organizations
Government policy is important, but community organizations are often the first line of defense. Groups like the Sham Shui Po District Council and local NGOs are running food banks, job training programs, and after-school tutoring. They need more funding and more support.
If you are a researcher or an investor, consider partnering with these organizations. They have the on-the-ground knowledge that data alone cannot capture. They can tell you which policies are working and which are failing.
A Final Look at the Numbers
Let’s summarize the key statistics for 2026.
- Citywide unemployment: 3.8%
- Unemployment in poorest districts: 7.2%
- Median income recovery in richest districts: 112% of 2019 levels
- Median income recovery in poorest districts: 74% of 2019 levels
- Food bank usage increase since 2019: 200% in poorest districts
- Mental health referrals increase since 2019: 45% in poorest districts
These numbers are not abstract. They represent real people and real struggles. They are a call to action for anyone who cares about a fair and just Hong Kong.
Rethinking What Recovery Really Means
We need to change how we talk about economic recovery. A recovery that only benefits the wealthy is not a recovery. It is a redistribution of wealth upward. The true test of an economic rebound is not the stock market or the GDP figure. It is whether the most vulnerable families in the city can afford a decent meal and a safe place to sleep.
The data from 2026 shows that we are failing that test. But it also shows us where to focus our efforts. The poorest districts are not beyond help. They need targeted investment, smart policy, and a commitment to equity.
Let’s use the data to make better decisions. Let’s track the How Many Hong Kong Residents Live in Poverty? Breaking Down the Latest Statistics by District and Demographics and hold our leaders accountable. And let’s remember that behind every data point is a person who deserves a fair shot at the recovery.
The ferry from Central to the outlying islands still runs. The gap between the towers and the neighborhoods is still there. But it does not have to stay that way. With the right data and the right action, we can close that gap. One district, one policy, one life at a time.

Post Comment