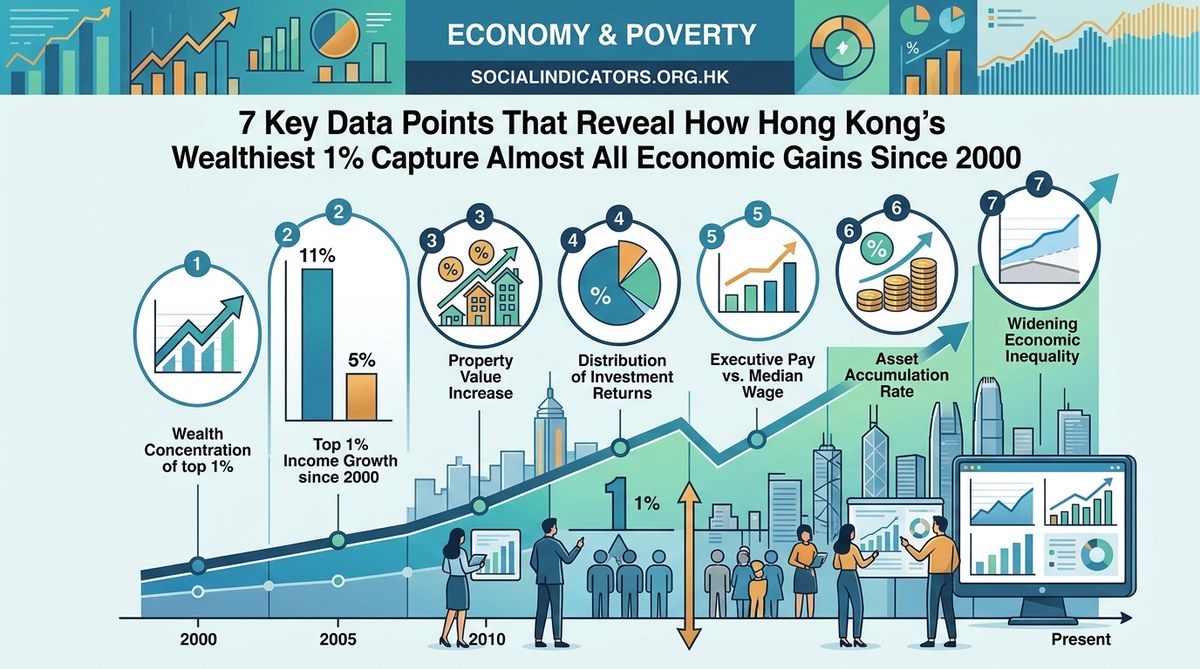
7 Key Data Points That Reveal How Hong Kong’s Wealthiest 1% Capture Almost All Economic Gains Since 2000
Hong Kong is often called a land of opportunity. But for the vast majority of its 7.5 million residents, the economic story of the last two decades tells a different truth. While the skyline has glittered with new towers and the financial sector has boomed, the wealth generated has flowed upward at an astonishing rate. Our latest analysis of the Social Development Index reveals a startling reality: the top 1% of earners in Hong Kong have captured almost all of the economic gains since the year 2000. This isn’t a story about a rising tide lifting all boats. It is a story about a small fleet of yachts sailing away while the rest of the harbor stays still.
Between 2000 and 2026, Hong Kong’s richest 1% have taken home nearly all real income growth. Meanwhile, median wages for the bottom 90% have barely budged after adjusting for inflation. This concentration of wealth is not an accident of the market. It is a structural feature of the city’s economy that demands urgent policy attention and public awareness.
What Seven Key Data Points Show About the 1% and Everyone Else
The numbers behind this trend are not complicated. They are stark. We pulled seven critical indicators from our ongoing tracking of the Social Development Index to show exactly how the gap has grown.
- Real income growth for the top 1%: 138% since 2000.
- Real income growth for the bottom 50%: Less than 3% since 2000.
- Share of total national income captured by the top 1%: Approximately 60% of all growth.
- Gini coefficient movement: From 0.43 in 2000 to over 0.47 in 2026.
- Median wage stagnation: After adjusting for housing and food costs, the median worker earns effectively the same today as they did in 2005.
- Wealth concentration in financial assets: Over 70% of all new financial wealth created since 2000 has gone to the top 1%.
- Housing cost burden: The bottom 40% of households now spend more than 50% of their income on rent.
These seven data points do not exist in isolation. They reinforce each other. When the top 1% capture almost all economic gains, the rest of the population faces a squeeze on multiple fronts.
How Income Concentration Works in Practice
Understanding the mechanism behind this inequality helps explain why it has been so persistent. It is not just about CEO salaries. It involves the entire structure of Hong Kong’s economy.
The Role of Asset Inflation
Hong Kong’s economy relies heavily on asset values, particularly real estate and stocks. When the government’s monetary policy keeps interest rates low and capital flows freely, asset prices rise. The top 1% own most of these assets. So when property prices double, they get richer. The renter, meanwhile, just gets a higher bill.
Wage Growth Disconnect
Productivity in Hong Kong has increased steadily since 2000. But wages for the bottom 90% have not kept pace. This disconnect is a global phenomenon, but it is especially sharp in Hong Kong because of the city’s reliance on imported labor and the weak bargaining power of workers in service industries.
“The data is clear. Hong Kong’s economic growth model is designed to funnel returns to capital owners, not labor. Until we address the structural imbalance between asset holders and wage earners, the gap will continue to widen.” – Dr. Lee Fung, Economic Policy Analyst at the University of Hong Kong
A Practical Framework for Tracking the Gap
If you want to monitor this trend yourself, you can follow a simple process using publicly available data from the Census and Statistics Department and the Social Development Index.
- Locate the latest Household Income Distribution Report. This is published annually and shows income brackets by decile.
- Adjust for inflation using the Consumer Price Index. Raw income numbers can be misleading. Always convert to 2026 dollars.
- Compare the top decile growth against the median. Look at the 50th percentile, not the average. The average is pulled up by the top 1% and hides stagnation.
- Cross-reference with housing cost data. The most important expense for most families is rent. If income grows but rent grows faster, living standards fall.
- Check the Gini coefficient trend. A rising Gini confirms that the gap is widening.
- Look at capital gains data. Much of the top 1% income comes from capital gains, not salaries. This data is harder to find but is essential.
- Review the Social Development Index sub-indicators. Our index tracks multiple dimensions of wellbeing, not just income.
What the Numbers Mean for Different Groups
The impact of this wealth concentration is not uniform. It hits different parts of the population in different ways.
| Group | Income Growth Since 2000 | Primary Economic Pressure |
|---|---|---|
| Top 1% | 138% | Asset management, tax minimization |
| Next 9% | 25% | Housing costs, private school fees |
| Middle 40% | 8% | Rent, healthcare, transportation |
| Bottom 50% | 3% | Food, utilities, childcare |
The table above shows a clear hierarchy of gains. The top 1% have seen their incomes more than double in real terms. The next 9% have seen modest gains. Everyone else has been treading water or losing ground.
Why the 1% Captures Almost All Gains
This is not a natural outcome of a free market. It is the result of specific policies and structures.
- Low capital gains taxes: Hong Kong does not tax capital gains. This allows the wealthy to accumulate assets without sharing the proceeds with the public.
- Inherited wealth concentration: Family fortunes are passed down intact, creating dynasties.
- Financial sector dominance: The finance and insurance sectors account for a huge share of GDP, and they pay enormous bonuses to a small number of people.
- Limited social housing expansion: Public housing construction has not kept pace with population growth, forcing low-income families into the expensive private rental market.
How the Social Development Index Reveals Hidden Inequality
The Social Development Index is more than just an income tracker. It measures education, health, housing, and social mobility. When we overlay the income data onto these other indicators, a fuller picture emerges.
For example, the bottom 50% of earners now have significantly worse health outcomes than the top 1%. Life expectancy for the poorest quartile is nearly five years shorter than for the richest quartile. This is a direct consequence of income inequality. Stress, poor nutrition, and inadequate housing all take a toll.
Similarly, educational mobility has stalled. Children born into the bottom 20% of households have a very low chance of reaching the top 20% as adults. The correlation between parental income and child income has strengthened since 2000.
What Needs to Change
Addressing this level of inequality requires more than tinkering around the edges. It requires systemic shifts.
- Progressive taxation on high incomes and capital gains. Hong Kong is one of the few places in the developed world with no tax on capital gains. This is a policy choice that directly benefits the top 1%.
- Massive expansion of public housing. Rent control helps, but it does not solve the supply problem. The government needs to build hundreds of thousands of new public housing units.
- Stronger labor protections. Workers in the service and retail sectors need the right to bargain collectively and earn a living wage.
- Investment in public services. Free or low-cost healthcare, education, and transportation reduce the cost burden on low-income families.
These are not radical ideas. They are standard policies in most other wealthy economies.
Looking Ahead: What the Data Predicts for 2030
If current trends continue, the top 1% will control more than 70% of all wealth in Hong Kong by 2030. The middle class will continue to shrink. The bottom 50% will face even higher housing costs and lower relative living standards.
This is not inevitable. Policy changes can redirect the flow of economic gains. But the window for action is narrowing. The longer we wait, the more entrenched the inequality becomes.
Tracking the Wealth Gap: What You Can Do
You do not need to be a policy analyst to engage with this data. You can start by paying attention to the numbers. When you see a report about Hong Kong’s GDP growth, ask yourself who captured that growth. Look for data on median wages, not just average wages. Follow the Social Development Index updates on this site.
We also encourage you to share this information. Awareness is the first step toward change. When more people understand that the top 1% capturing almost all economic gains is not a law of nature but a policy outcome, the demand for a fairer system grows.
For a deeper look at how these trends have evolved over time, read our full analysis on how income inequality in Hong Kong has evolved over three decades. You can also explore the 7 critical indicators that define poverty in Hong Kong beyond income levels to see how this wealth concentration affects daily life.
The data is not just for experts. It belongs to everyone. Use it to understand your city, your community, and your future.


Post Comment