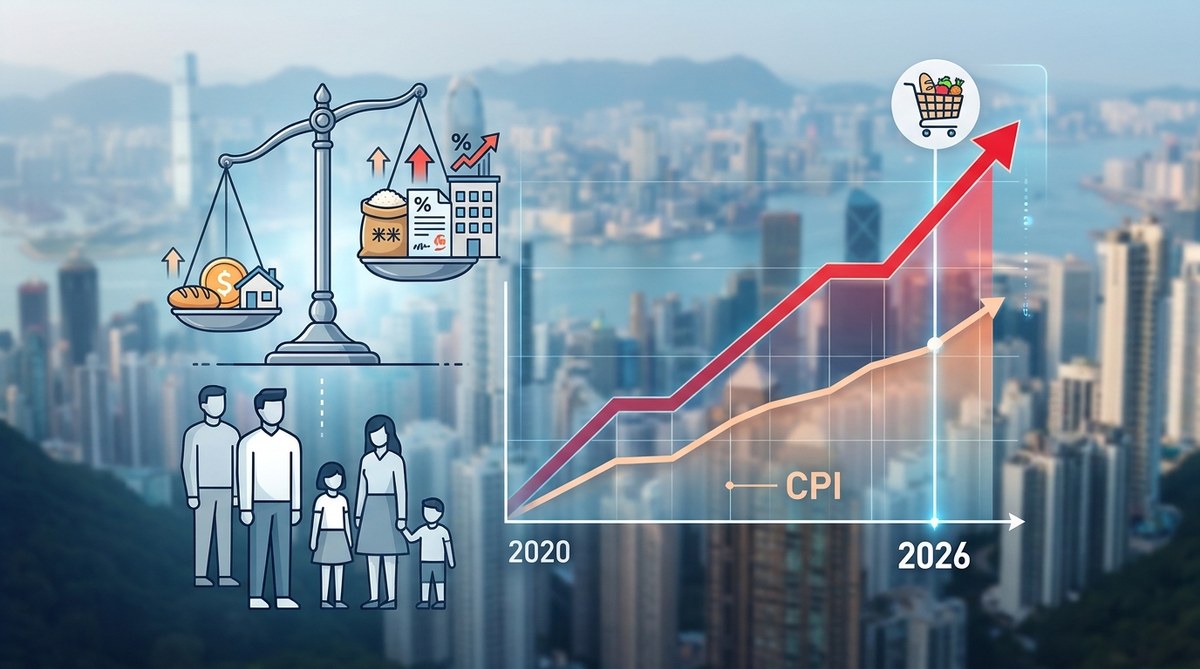
How Hong Kong’s Inflation in Essential Goods Outpaces General CPI, Widening the Poverty Gap in 2026
In Hong Kong, the cost of living is not a single number. The headline Consumer Price Index, or CPI, which is often reported as a general inflation figure, paints a picture of moderate price increases. But for a family in a subdivided flat in Sham Shui Po, the reality is far more severe. The prices of the things they cannot skip, things like rice, cooking oil, electricity, and rent for basic shelter, are climbing at a rate that the average CPI simply does not capture. This gap between the inflation of essential goods and the general CPI is not a statistical quirk. It is a mechanism that is actively widening the poverty gap in 2026.
In 2026, Hong Kong’s general CPI understates the real cost burden on the poor. Essential goods like food, housing, and energy are inflating at roughly double the rate of the headline CPI. This divergence traps low-income households in a cycle where wage growth cannot keep pace with the cost of survival, deepening inequality and making the poverty line an inadequate measure of hardship.
The Two-Track Inflation Problem
To understand what is happening, you need to see the two different tracks of inflation in Hong Kong. The general CPI includes a wide basket of goods and services. It includes luxury handbags, international travel, sushi dinners, and the latest electronics. When wealthy consumers spend less on these discretionary items, the overall index goes down, even if the cost of milk and eggs is shooting up.
In 2026, this divergence has become extreme. The general CPI for Hong Kong is hovering around 3.2% year-on-year. This number is often cited by officials to show that inflation is under control. But if you strip away the discretionary spending of the top 20% of earners, a different story emerges.
Essential goods, which are defined as food, housing, utilities, and basic transport, are inflating at a rate of 6.8%. This is more than double the headline figure.
- Food inflation is being driven by global supply chain disruptions and a weaker Hong Kong dollar, pushing up the cost of imported grains and meats.
- Housing costs, particularly rent in the private low-end market, have risen by 7.5% as supply of affordable units shrinks.
- Utility costs, including electricity and water, have jumped by 9% due to fuel price adjustments.
The result is that the poorest 20% of households are spending over 60% of their income on these essentials. When those prices rise at 6.8%, it squeezes their budget for everything else. For the wealthiest 20%, essentials make up less than 25% of their spending, so the same inflation rate has a much smaller impact.
How the CPI Mask Hides the Poverty Gap
The CPI is designed to reflect the average spending patterns of an average household. But in a city with extreme income inequality, there is no average household.
The standard CPI calculation uses a fixed basket of goods. This basket is updated periodically, but it inherently assumes that everyone buys the same things. A wealthy family might allocate 5% of their budget to transportation. A low-income family might allocate 15%. If transport costs rise by 10%, the CPI weights it as a 5% increase across the board. The actual pain for the low-income family is three times higher.
This statistical smoothing hides the true burden. When we talk about the poverty line in Hong Kong, it is often set at 50% of the median household income. But that line does not adjust for the fact that the things a poor family must buy are inflating faster than the things a rich family buys. In effect, the real poverty line, the amount of money needed to buy a basic basket of survival goods, has risen faster than the official poverty line.
“The official CPI is a useful tool, but it was not designed to measure the cost of living for the poor. When essential goods inflate faster than luxury goods, the CPI becomes a tool that obscures the crisis. We need a separate index for basic necessities.” Dr. Mei Lin, Economist at the University of Hong Kong.
A Table of Divergence: Essential vs. General Inflation in 2026
The table below shows the estimated inflation rates for different categories in Hong Kong for 2026. It clearly shows where the pressure points are.
| Category | General CPI Weight | Inflation Rate (2026 est.) | Impact on Low-Income Households |
|---|---|---|---|
| Food & Non-Alcoholic Beverages | 20% | 5.5% | Very High (largest budget share) |
| Housing & Utilities | 30% | 7.0% | Very High (rent & electricity soaring) |
| Transport | 10% | 4.5% | High (essential for work) |
| Healthcare | 5% | 3.0% | Moderate (but rising) |
| Recreation & Culture | 8% | 1.0% | Low (often cut from budget) |
| Restaurants & Hotels | 6% | 2.5% | Low (rarely used by poor) |
| Clothing & Footwear | 4% | 1.5% | Low (purchased infrequently) |
| Miscellaneous Goods & Services | 17% | 2.0% | Low |
The table highlights a clear pattern. The categories with the highest inflation rates, food, housing, and utilities, are exactly the ones that make up the largest share of a low-income household’s budget. The categories with low inflation, like recreation, restaurants, and clothing, are the ones that wealthy households spend more on.
The Three Ways This Widens the Poverty Gap
The divergence between essential goods inflation and general CPI widens the poverty gap through three distinct mechanisms.
-
Real Income Shrinkage for the Poor. Wages for low-income workers in 2026 are rising at roughly 3.5% per year. This is slightly above the general CPI of 3.2%, which sounds like a win. But it is far below the essential goods inflation of 6.8%. This means the purchasing power of their wages is actually falling by over 3% per year. They are getting poorer in real terms, even as their nominal income rises.
-
Asset Inflation for the Rich. The wealthy do not just rely on wages. They hold assets, primarily property and stocks. In 2026, luxury real estate prices have stagnated, but they have not crashed. Meanwhile, the stock market has seen modest gains. The wealthy are not being squeezed by essential goods inflation because they spend a smaller fraction of their income on them. Their wealth is largely protected.
-
The Debt Trap. When a low-income family cannot afford a 6.8% rise in essential costs, they often turn to credit card debt or informal loans. In 2026, interest rates remain high. The debt grows faster than their income. This pushes them further below the poverty line and makes it nearly impossible to save or invest.
These three mechanisms create a self-reinforcing cycle. The poor get poorer in real terms, the rich maintain their wealth, and the statistical gap widens.
Why the 2026 Data Demands a Policy Response
The data for 2026 is not just a snapshot. It is a warning signal. The Social Development Index, which we monitor closely, shows a clear correlation between rising essential goods inflation and a decline in social wellbeing indicators. Food bank usage is up 15% year-on-year. Applications for rental assistance are at an all-time high.
If you are a policy analyst or a socially conscious investor, this data changes the conversation. You cannot look at the general CPI and say inflation is under control. You have to ask: inflation for whom?
To address this, we need to consider three practical steps for policymakers and advocates:
- Create a separate Essential Goods Price Index. This index would track the prices of the 50 most critical survival items. It would provide an early warning system for cost-of-living crises.
- Index welfare payments to essential goods inflation. Currently, social security payments are often tied to the general CPI. They should be tied to the essential goods index to ensure they maintain purchasing power.
- Invest in price stabilization for basic foods. The government could subsidize key imports or support local production of staples like rice and eggs to cap price increases.
For investors, this data suggests that companies providing essential services, like utilities and basic food distribution, may have pricing power that is hurting the poor. There is a growing market for social impact bonds and investments that specifically target affordable housing and food security.
How to Track This Data Yourself
You do not need to be a professional economist to spot the divergence. You can monitor it with a simple process.
- Find the monthly CPI release from the Census and Statistics Department of Hong Kong. Look for the “Composite CPI” and the “Year-on-Year Change.”
- Look for the sub-indices. The CPI is broken down into categories like Food, Housing, and Transport. Compare the inflation rate for these categories to the overall rate.
- Check the weightings. Understand that the CPI uses a weighting system. If Food has a 20% weight and it inflates at 6%, it contributes 1.2% to the overall CPI. But if a poor family spends 40% of their income on food, that 6% inflation hits them much harder.
- Cross-reference with wage data. Look at the average wage growth for the lowest decile of earners. If wage growth is below the inflation rate for essential goods, the poverty gap is widening.
- Read the Social Development Index. We publish annual reports that track these trends. You can see how changes in the cost of living correlate with health, education, and housing stress.
By following these steps, you can see the real story behind the numbers.
The Real Story in the Numbers
The gap between essential goods inflation and the general CPI is not a niche economic debate. It is the central driver of inequality in Hong Kong in 2026. The people who can afford to buy new cars and eat out every week are barely feeling the pinch. The people who are counting every dollar to pay for rent and rice are being crushed.
The data is clear. The general CPI is a misleading indicator of the health of the economy for the bottom half of the population. We need to change how we measure inflation, how we set the poverty line, and how we target social welfare. The tools exist. The data exists. The question is whether we have the will to use them.
Moving Beyond the Headline Number
The next time you see a headline that says “Hong Kong Inflation Stable at 3%,” remember that this number is an average. It averages the experience of the billionaire in the Peak with the experience of the cleaner in Wong Tai Sin. It hides the fact that the cost of survival is rising much faster than the cost of living.
We encourage you to look at the sub-indices. Look at the data for food, housing, and energy. That is where the real story of 2026 is being written. And for those of us who care about social equity, that is the story we need to tell.

Post Comment