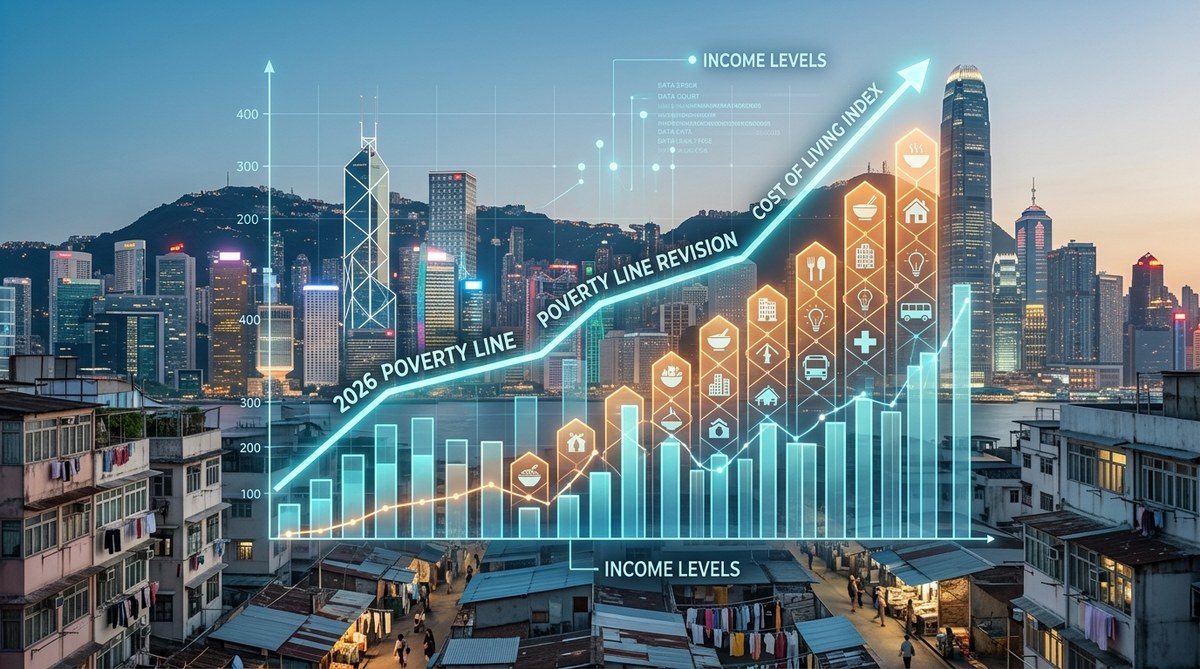
What the 2026 Poverty Line Revision Reveals About Hong Kong’s Cost of Living Crisis
Every year, the Hong Kong government updates its official poverty line. For researchers and concerned citizens tracking economic inequality, that one number matters more than most. The 2026 revision is out, and it paints a stark picture. The line itself has moved upward. That shift reflects what millions of residents already feel in their daily lives: the cost of everything from rent to rice has outpaced wage growth. But the real story is not just the number. It is what the revision reveals about the gap between how we measure poverty and how poverty is actually lived in Hong Kong today.
The 2026 poverty line revision sets the threshold at HK$14,500 for a one person household, up roughly 8% from 2024. Yet over 1.5 million residents still fall below it. Housing remains the single biggest driver of deprivation. The Social Development Index confirms that non income factors like health and education access are deteriorating fastest in low income districts. This is not just a number; it is a policy alarm.
How the Poverty Line Is Calculated in Hong Kong
Hong Kong uses a relative poverty measure. The line is set at 50% of the median household income. If the median goes up, the poverty line goes up. If wages stagnate, the line barely moves. The 2026 revision saw the median income grow modestly, pushing the poverty line higher. But that does not mean life got easier. It means the baseline for being considered “not poor” has risen, while many residents’ actual purchasing power has shrunk.
The Census and Statistics Department publishes the figures each year. For 2026, the new thresholds are:
| Household Size | 2026 Poverty Line (monthly) | Change from 2024 |
|---|---|---|
| 1 person | HK$14,500 | +5.2% |
| 2 persons | HK$20,300 | +4.8% |
| 3 persons | HK$25,800 | +4.5% |
| 4 persons | HK$31,500 | +4.3% |
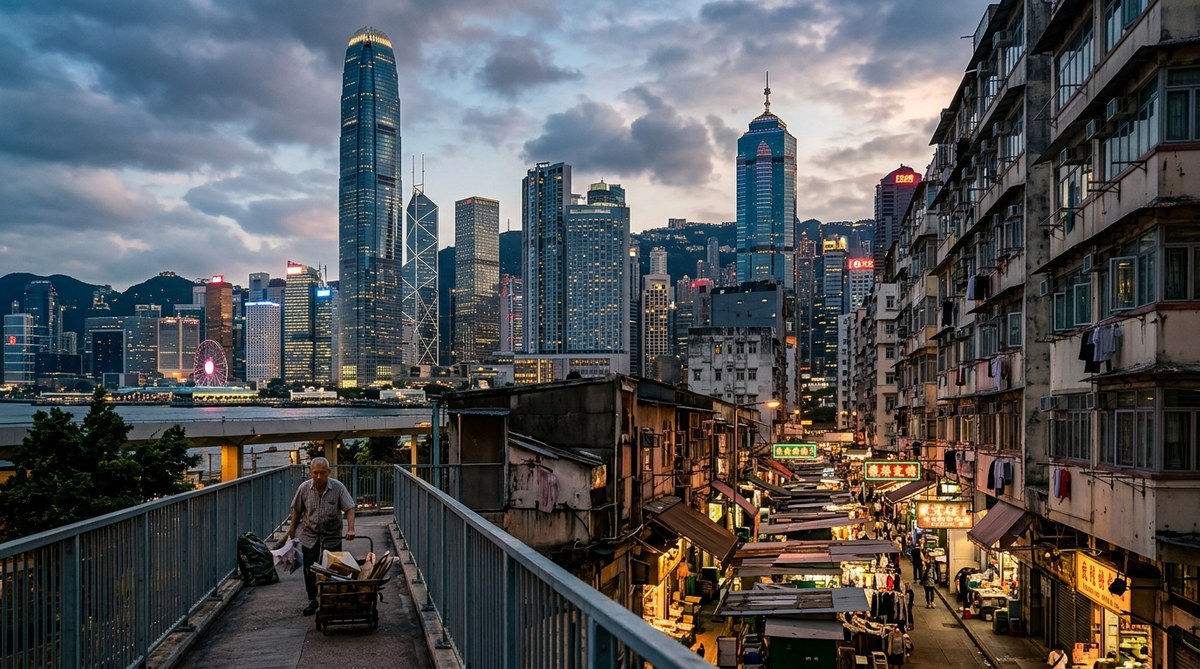
These numbers hide wide variation across districts. In Sham Shui Po, over 30% of households fall below the line. In Central and Western, the rate is below 15%. The line is national, but poverty is local.
What the 2026 Revision Reveals About Cost of Living
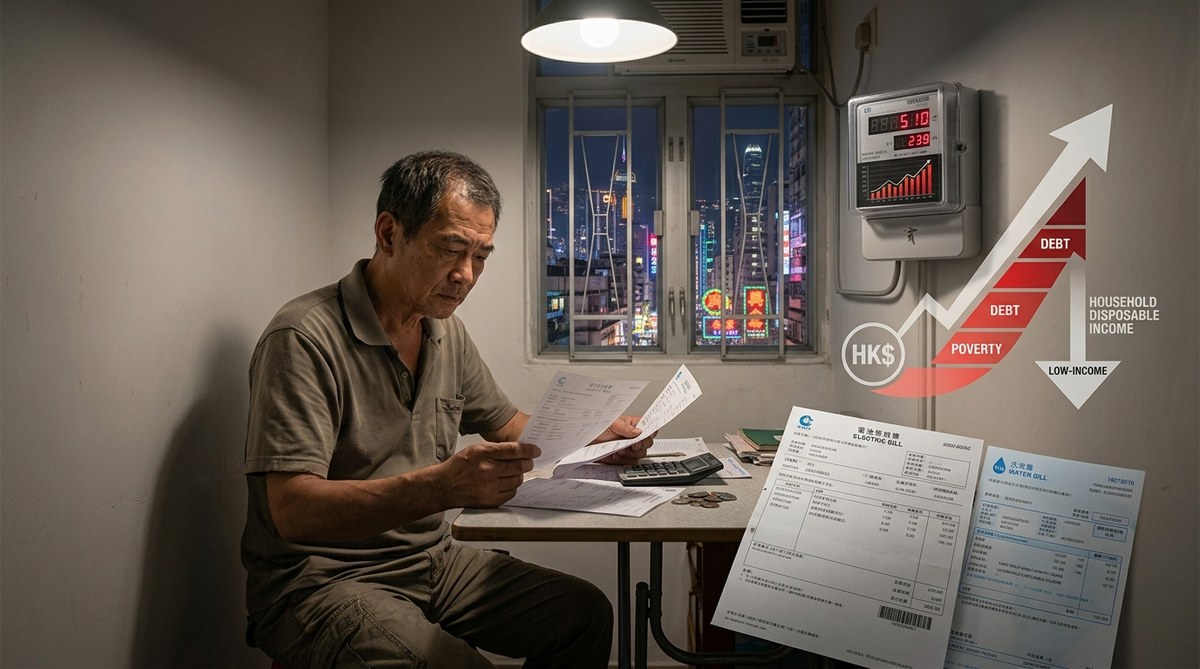
The 2026 adjustment tells us that median incomes increased slightly, but the cost of essential goods rose faster. That leaves more households in the “low income but not officially poor” zone, just barely above the line. They are vulnerable. One medical bill or a rent hike could push them under.
The biggest cost driver is housing. Private rents in areas like Kwun Tong and Yuen Long have climbed 10% since 2024. Public housing wait times still average over five years. The poverty line revision captures the income side but struggles to reflect housing stress. A household earning HK$15,000 a month might be above the one person line, but if they pay HK$8,000 in rent, they have little left for food, transport, or healthcare.
Here are the main cost categories squeezing households:
- Housing: private rentals and subdivided flats consume 50% or more of income for many low earning families.
- Food: basic grocery prices are up 6% year over year, driven by imported goods and supply chain costs.
- Transportation: MTR fares rose again in 2026, hitting residents in New Territories hardest.
- Utilities: electricity tariffs increased, adding another HK$200 per month for average households.
When you add it all up, the household survival budget now exceeds the poverty line for many single earners. This is what the revision cannot fully capture: the chasm between the statistical line and the lived reality of making ends meet. For a deeper look at how wages have grown versus essential expenses, see the hidden cost of living crisis tracking essential expenses vs wage growth since 2010.
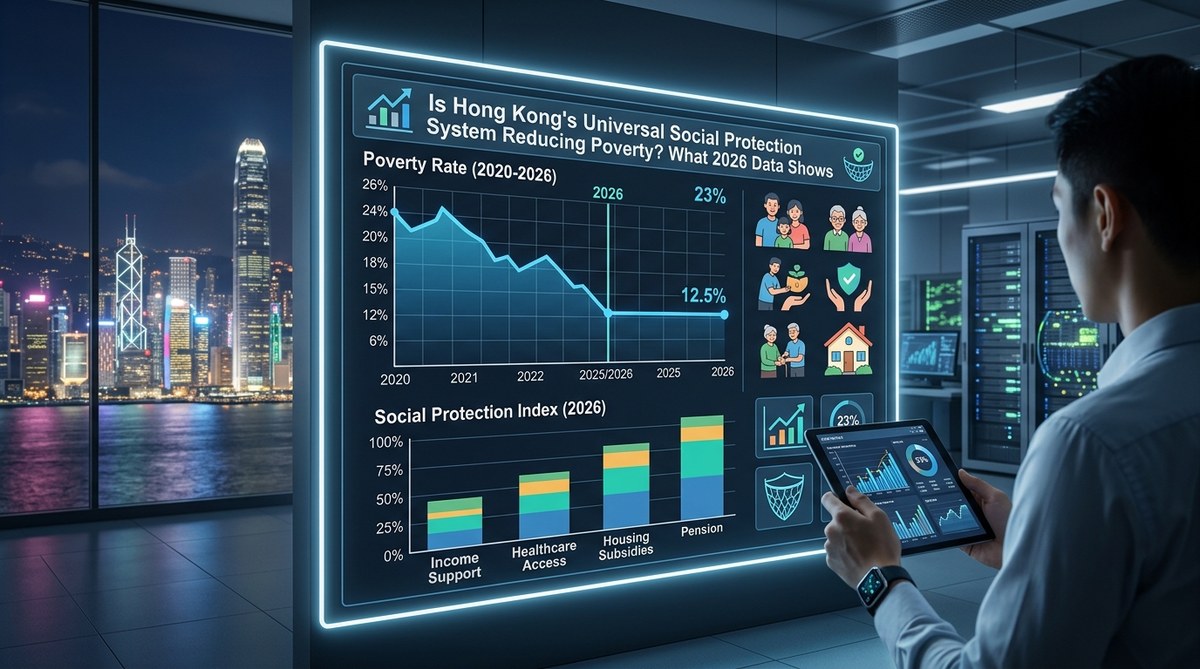
The Social Development Index Connection
The poverty line is an income metric. But poverty is multidimensional. That is where the Social Development Index (SDI) comes in. The SDI tracks 13 domains including health, education, housing, and social participation. The latest 2026 data shows that districts with high poverty rates also score lowest on the SDI, and the gap is widening.
For example, Sham Shui Po and Kwun Tong not only have higher poverty rates but also worse health outcomes and lower educational attainment. The SDI reveals that income alone does not explain disadvantage. Lack of access to green spaces, limited healthcare facilities, and overcrowded housing compound the problem.
“The 2026 poverty line revision is not just an arithmetic update; it is a warning signal that the cost of living is outstripping the capacity of social safety nets. When you overlay the SDI data, you see that the same districts falling behind on income are also losing ground on health and education. That is a recipe for entrenched inequality.” — Dr. Mei Ling Chan, Hong Kong Institute of Social Research.
To understand how the SDI uncovers these patterns, read how Hong Kong’s Social Development Index reveals hidden inequality patterns.
3 Practical Steps for Researchers and Citizens
You do not need to be a government statistician to make sense of these figures. Here are three ways to use the 2026 data effectively:
-
Check the methodology behind the line. The official poverty line uses pre intervention income (before welfare transfers and taxes). That means the actual living standard may be slightly better for households receiving subsidies. Always look at the post intervention rate for a fuller picture. The government publishes both.
-
Compare district level breakdowns. The city wide rate masks huge disparities. Download the Census and Statistics Department’s district tables and see how your own area compares. For example, if you live in Tuen Mun, the poverty rate may be close to 25%. That matters for community organizing and local advocacy.
-
Pair income data with non income indicators. Use the SDI to assess whether a district’s poverty is accompanied by poor health or low education levels. That combination requires different policy responses. The complete guide to interpreting social development data for policy advocacy can walk you through the process.
Common Data Interpretation Mistakes
Even well intentioned researchers can misinterpret poverty statistics. Here is a table that contrasts correct approaches with common errors.
| Correct Approach | Common Mistake |
|---|---|
| Use post intervention income to measure actual living standards. | Relying solely on pre intervention income, which overstates poverty for welfare recipients. |
| Analyze poverty rates by household size and composition. | Treating the one person household line as a blanket threshold for all families. |
| Compare year on year changes using inflation adjusted figures. | Comparing nominal poverty lines without accounting for rising costs. |
| Cross reference with district level data. | Assuming the city wide average applies everywhere. |
Another common pitfall is ignoring the working poor. Many households above the poverty line still struggle because of high housing costs. The poverty line does not capture housing stress well. That is why 7 critical indicators that define poverty in Hong Kong beyond income levels is essential reading.
Beyond the Poverty Line: What to Watch Next
The 2026 revision is a snapshot. To understand the full picture, you need to track other trends:
-
The working poor: employment does not guarantee escape from poverty. Low wage jobs in retail, cleaning, and food services often pay below a living wage. Our analysis in understanding the working poor employment statistics that challenge common assumptions shows that one in five working adults in Hong Kong earns less than the poverty line for a single person.
-
Youth unemployment: young people aged 15 to 24 face an unemployment rate nearly three times the city average. This group is at risk of long term scarring. Read youth unemployment and underemployment statistical trends shaping a generation for data and policy implications.
-
Elderly poverty: seniors are disproportionately poor, especially those living alone. The 2026 poverty line revision does little to address their fixed incomes and high medical costs. The district level data in how many Hong Kong residents live in poverty breaking down the latest statistics by district and demographics shows that elderly poverty rates exceed 40% in some areas.
A Call for Informed Advocacy
The 2026 poverty line revision is not the final word. It is a starting point. For researchers, the data provides evidence to push for targeted policies: more public housing, expanded in work benefits, and a higher minimum wage. For concerned citizens, understanding the numbers means you can hold policymakers accountable.
This year’s adjustment confirms what many already suspected: Hong Kong’s cost of living crisis is deepening, and the safety net has holes. But the data also gives us a roadmap. By combining the poverty line with the Social Development Index and district level statistics, we can see exactly where the gaps are. Now the question is whether we will use that knowledge to close them.
The 2026 numbers are in. They tell a story of rising costs and stagnant opportunities. But numbers alone do not change anything. People do. So take these figures, share them with your community, and demand more from the systems that are supposed to protect the most vulnerable. That is how a line on a spreadsheet becomes a lever for change.
Post Comment